The use of hidden Markov models is a powerful modern statistical technique that has been applied to many subject areas, from predicting political crises to the reconstruction of DNA and the recognition of speech. It has been claimed that this technique is of some relevance to cryptanalysis, and this may very well be true, considering its nature.
The September 1964 issue of Scientific American illustrated a Markov chain by showing two containers with numbered balls in them. Numbered slips of paper were drawn repeatedly, with replacement, from a third container, and each time, the ball whose number was drawn was transferred to the one of the first two containers other than the one it was in.
The number of balls in the first container, which initially contained all of them, would typically decline in a fashion that resembled exponential decay to containing only half of the balls. This modelled the physical process of allowing two chambers, containing a gas at different levels of pressure, previously separated, to be connected.
This illustrated the basic feature of a Markov process. It involves probability. But in addition to a random event, the final result, in this case the number of balls in the first container, also depended on the 'memory' of the system.
This particular example, however, involves a system with a large number of states, although all the states with the same number of balls in the first container can be considered equivalent due to symmetry. In the formulation of hidden Markov models, each state is referred to individually, and thus illustrative examples of these models have a small number of states.
In a hidden Markov model, then, a system has a number of states, S(1) to S(n). The probability that the system, if it was in state i on one turn, will be in state j in the next turn, is called P(i,j). The states of the system are not known, but the system does have one observable value on output, which has m possible values from 1 to m. For the system in state i, the probability that output value v will be produced is called O(i,v).
Note that the transition probabilities depend only on the state, not the output.
The following example involves a state which depends on the output:
Someone with two dice, one red and one blue, the red die marked with H on two faces, and T on the other four, and the blue die marked with H on four faces, and T on the other two, is providing you with a sequence of H and T produced by the dice, based on the rule that whenever H comes up, the red die is thrown next time, and whenever T comes up, the blue die is thrown next time.
This produces a sequence of heads and tails that has each output equally often, but which favors alternations over repetitions.
Such models can be transformed into models which depend only on the state by including the previous output in the following state. This example, though, can't form part of a hidden Markov model, since the previous output completely specifies the following state.
But it can form the basis of a somewhat more elaborate example.
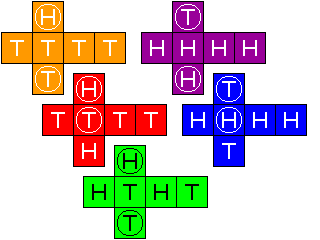
Let us think of five dice, with colors and faces as follows:
orange htTTTT      purple HHHHht
red    HhtTTT      blue   HHHhtT
          green  HHhtTT
where the lowercase letters indicate circled uppercase letters on the faces of the dice, as illustrated below:
and the exact rules for using these dice will be given below.
But it will be easier to understand those rules if we think of this set of dice having been gradually built up starting from just the red and blue dice, using simpler rules.
The red die favors T, and the blue die favors H. One way to produce a sequence of H and T with the dice would be to always throw a die that favors the symbol opposite to the one previously thrown.
Then we add a second set of dice, orange and purple. As with the red and blue dice, the orange die favors T, and the purple die favors H. But with this pair of dice, the favoritism is stronger.
So, now, we add some rules. When throwing the red or the blue die, if we get the result that is not favored, thus throwing a second H or T in a row, we switch on the next turn to the pair of dice with stronger favoritism. When throwing the orange or the purple die, if we get the result that is favored, we relax, and switch to the less biased red and blue dice. With the additional dice, a throw of H always implies we use one of the dice that favor T, but now either the red die or the orange die is possible, and similarly for the blue and purple dice and a throw of T.
Then we extend the model to bring in a green die, that is 'below' the red and blue dice in the same way that the orange and purple dice are 'above' the red and blue dice. Now, a favored result with the red and blue dice moves down to the green die. Results on the green die are always treated as if they were not favored, resulting in a move to increased bias with the red and blue dice.
But to allow some variation in how the model moves from state to state, even given the previous state as well as whether an H or a T was thrown, I then added the circled H and T, which cause one to stay with the dice having the current level of bias.
Thus, the exact rules are:
This does not have the proper form for a hidden Markov model as it stands, because the next state depends on the output from a state as well as the previous state. If we take the probability of the next state, interpreted as the color of the die being thrown, and the probability of the two outputs H and T from each state, these probabilities are not independent.
In order to consider this situation with a hidden Markov model, we need to do two things. The first thing is to shift the outputs in time: to consider that the output from throwing the red die is always H, based on the face that turned up in the previous throw of the dice. This lets the random event of the die throw show up once only, in the state transition, and not in two separate places where it is not independent.
The second thing is to divide the state of throwing the green die into two states, HG and TG, indicating whether H (or h) or T (or t) was face up on the previous throw, so that this forwards assignment of the output can work.
This can be analyzed as a hidden Markov model by thinking of six states: O, P, R, B, and HG and TG, as follows:
                Next State, Face Showing
State   Output     O  P  R  B HG TG
  O        H      1h 1t    4T
  P        T      1h 1t 4H
  R        H      1H    1h 1t    3T
  B        T         1T 1h 1t 3H
 HG        H            2H 2T 1h 1t
 TG        T            2H 2T 1h 1t
The numbers in the state transition matrix are chances out of six.
Knowing the details of the model, we can ask the question of how it will behave. This is essentially a trivial question, because it can be solved by what is almost simple arithmetic, and what is standard algebra.
One must find a set of probabilities for the states such that, when these probabilities are fed into the state transition matrix, the same probabilities will come out. Since probabilities must add up to 1, this problem is equivalent to finding the eigenvectors of a matrix (vectors, that when multiplied by a matrix, produce the same vector, possibly multiplied by a constant).
Here, it is obvious that each of O, R, and HG will have the same probability as its counterpart P, B, and TG, and we can just consider the scaled-down matrix
    OP RB  G
OP   2  4
RB   1  2  3
G       4  2
giving the three equations
a' = 1/3 a + 1/6 b
b' = 2/3 a + 1/3 b + 2/3 c
c' =         1/2 b + 1/3 c
in which we can promptly replace a', b', and c' by a, b, and c. (If a is the probability of OP at time t, a' stands for its probability at time t+1, but we are looking for solutions where the probability is constant.)
Thus, these equations simplify to:
2/3 a = 1/6 b
2/3 b = 2/3 a + 2/3 c
2/3 c = 1/2 b
and the first and third equations are enough to tell us that
4a = b
4c = 3b
so a, b, and c are in the proportions 1:4:3, making the equilibrium probabilities that each color of die will be used:
orange 1/16
purple 1/16
red    1/4
blue   1/4
green  3/8
Incidentally, without circled letters, except that the lone H on the orange die, and the lone T on the purple die would still behave as if circled, the steady state probabilities would instead work out to:
orange 3/31
purple 3/31
red    15/62
blue   15/62
green  10/31
from the simplified matrix
    OP RB  G
OP   1  5
RB   2     4
G       6
Calculating the probability of an individual sequence of outputs from such a model can be performed by straightforward arithmetic. Knowing the initial state, let us say that we began by throwing the green die, what is the probability of throwing HTH?
On the first throw, the chance of throwing H or h is 1/2.
On the second throw, our chance of using the green die again (having thrown h) is 1/3, and the chance of throwing T or t with it is 1/2. Our chance of using the red die (having thrown H) is 2/3, and our chance of throwing T or t with it is 2/3. So our total chance of throwing T or t is 1/6 + 4/9, or 11/18.
On the third throw, our chance of using the green die is equal to the sum of 1/3 (our chance of having used the green die on the last turn) times 1/3 (our chance of throwing t with it, given that we threw T or t) and 2/3 (our chance of having used the red die on the last turn) times 3/4 (our chance of throwing T with it, given that we threw T or t). Using the green die, our chance of throwing H or h is 1/2.
Our chance of using the blue die, similarly, is equal to the sum of 1/3 times 2/3 and 2/3 times 1/4. Using the blue die, our chance of throwing H or h is 2/3.
Calculating these probabilities in a naive fashion, however, leads to a large amount of multiplication due to the constantly expanding tree of probabilities. The method known as the forward calculation avoids this: what must be done is to remember to keep adding together all the probabilities of using a particular color of die in a given step, instead of each time multiplying them all out from the beginning.
A more advanced problem is this: given a particular sequence of outputs, can we determine the set of internal states that most likely gave rise to it?
The method used for solving this problem is called the Viterbi algorithm. (You may have already heard this name in connection with the patented technique of Viterbi decoding applied to error-correcting codes.)
We could assume that the color of die used for the first throw is selected according to the equilibrium probabilities calculated above; but a Markov process does not need to start at equilibrium, as our other example showed. So let us assume that the first throw is of the green die.
If the sequence of outputs is as follows: HTHHTTHTHTHHTT, then for a particular sequence of colors of dice, we can, as Viterbi proved, simply assign a weighting value to that sequence based on multiplying together the individual probabilities of each state transition, and each output given the assumed state. So the sequence with the highest weight is the most probable.
In this example, though, each state produces a specific output with probability 1. Having circled letters on the dice does mean at least that the (following) output and the state do not together strictly determine the following state.
Because of this, to allow the Viterbi algorithm to be more properly illustrated, I will complicate the model slightly more, by adding a white die with five blank faces, and one marked with an X. If the face marked with an X turns up, the output will be inverted, so that it will be H in the next turn when either T or t turns up in the current turn, and T in the next turn when either H or h is thrown on the die.
Thus, if for the sequence of outputs
  H  T  H  H  T  T  H  T  H  T  H  H  T  T
TG  R TG  R  O  B  P  R TG  R TG  R  O  B
is assumed as the sequence of states, the weighting for that particular sequence of states would be calculated like this:
Given state TG, the probability of state R on the next turn is 1/3 overall, but given that we know we will have an output of H, the weight of this particular sequence is 1/3 * 5/6, the overall probability of state R times the probability it will be associated with an output of H in our more complicated model.
Note that when the white die is thrown doesn't really matter, again, in a sense we're throwing it a turn early.
Then, given state R, the overall probability of state TG on the next turn is 1/2. The probability that this state will be associated with an output of T is once again 5/6.
It is clear that for any sequence of outputs and states, a weighting can be calculated. But for a given long sequence of outputs, there is an immense number of possible sequences of states to choose from in order to find the most probable. This is what the Viterbi algorithm helps to deal with.
If we consider the possibilities for the first n states, we retain not just the set of states with the highest weight, but also the set of states with the highest weight for all other possibilities for the state at time n in addition to the one in the set of states with overall highest weight.
Then, to obtain the set of states with overall highest weight for the first n+1 states, and also the set of states with highest weight for any possible state at time n+1, we only need to consider possibilities involving the sets of states from time 1 to time n that we previously retained.
This is the most complicated of the problems. Here, we assume that the model has one or more variable parameters in its description, and we are looking for the values of those parameters which would make an observed sequence of outputs the most likely.
Two major methods are used. One, the segmental K-means method is used for obtaining an initial approximation to the model, and involves assuming that a particular set of states accompanies the known outputs. The Baum-Welch estimation algorithm is then used to obtain the best fit of the model to the output sequence considering all possible sequences of states that could have produced the known output.
One of the statistical concepts used in carrying out these methods is the Kullback-Leibler distance measure, used to compare two probability distributions. And yes, that is Solomon Kullback, from among the team of cryptanalysts who solved PURPLE.