Well, this projection
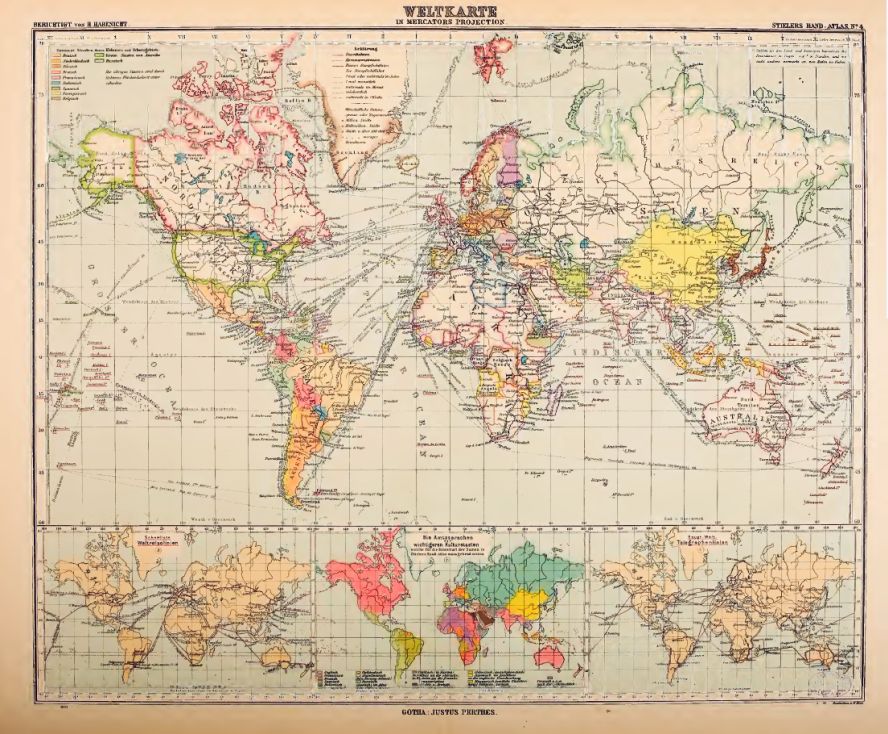
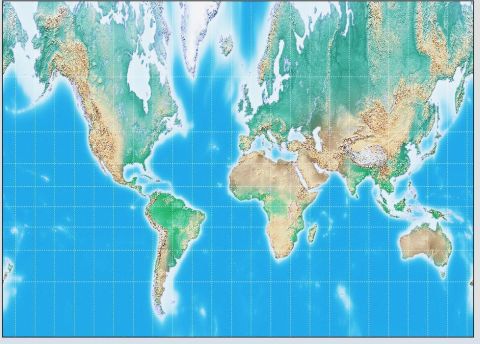
is one you have doubtless seen many times, looking like this, for example:
or like this:
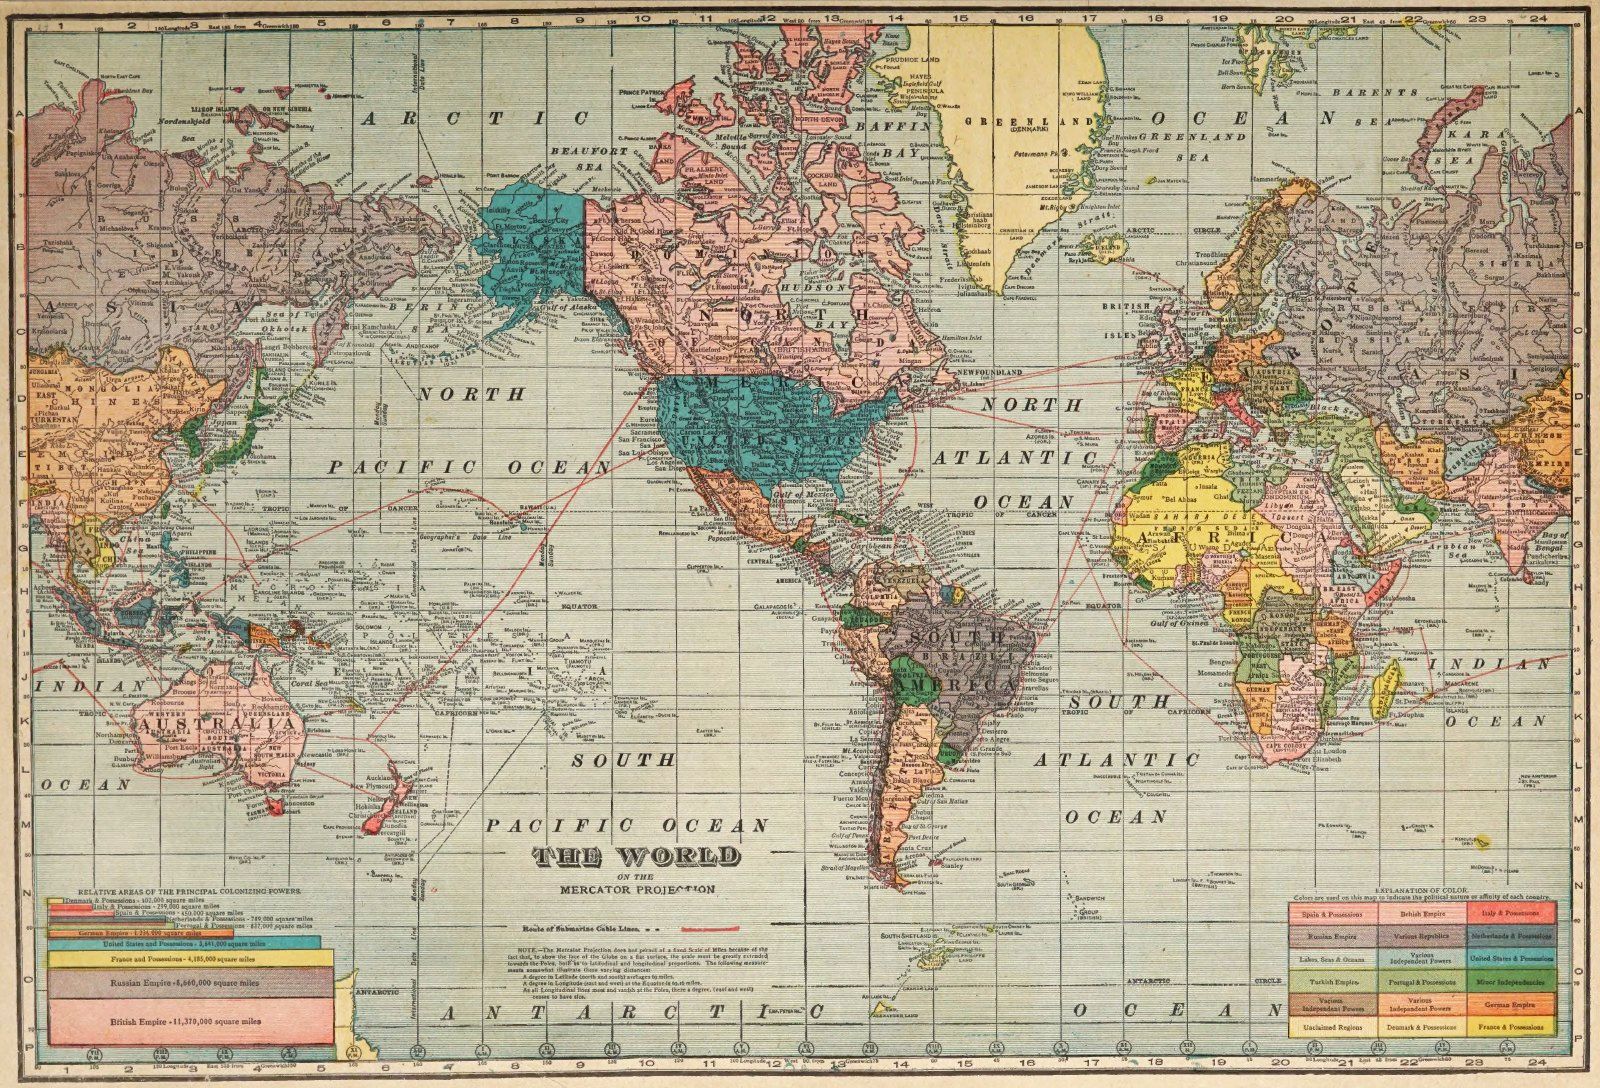
As you may have noticed, this is quite an old map; Greenland still has a small part that is not shown. It was the Denmark expedition which concluded in 1908 that filled in the final pieces of the map of Greenland, so one can see Greenland as we would expect in atlases published as early as 1910, as shown below:
Antarctica, though, is still not yet complete. In fact, there is also a part of the coastline of Ellesmere Island that isn't fully known at the time this map was drawn.
On this map, the northern portion of Ellesmere Island is named "Grant Land", which name is even used today for the northern lobe of the island, although I had never noticed it before. In researching the name, I found the following quote:
"The United States very foolishly renouced its claims to Grant Land in the Arctic when we purchased the Virgin Islands."
This renunciation, however, was given to Denmark, from which the Virgin Islands, or, more precisely, the United States Virgin Islands, as opposed to the British Virgin Islands, which haven't gone anywhere, were purchased in 1917, not to Britain - or Canada, to which the British Arctic Territories were transferred in 1880. And the quote is from a 1931 article written by Major-General William Mitchell, best known as "Billy" Mitchell, a visionary concerning the importance of air power... it is not, as one might have thought given certain current events, a quote from, say, a Truth Social post.
Grant Land was named after American President Ulysses S. Grant by the Arctic explorer Charles Franklin Hall, who had thought that it was itself an island, during the 1871 Polaris Expedition.
And even the Soviet Union made use of the Mercator projection occasionally:
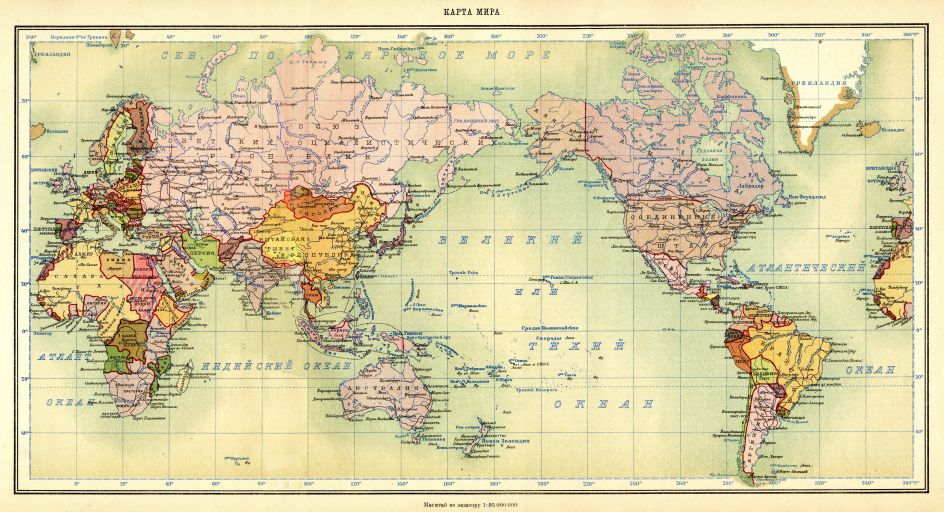
Can you find Tannu Tuva on this map? (It is shown. It's that small green area just above the West side of Mongolia, which is shown in orange.)
And here is one from the Defense Mapping Agency in the United States that you may have seen before:
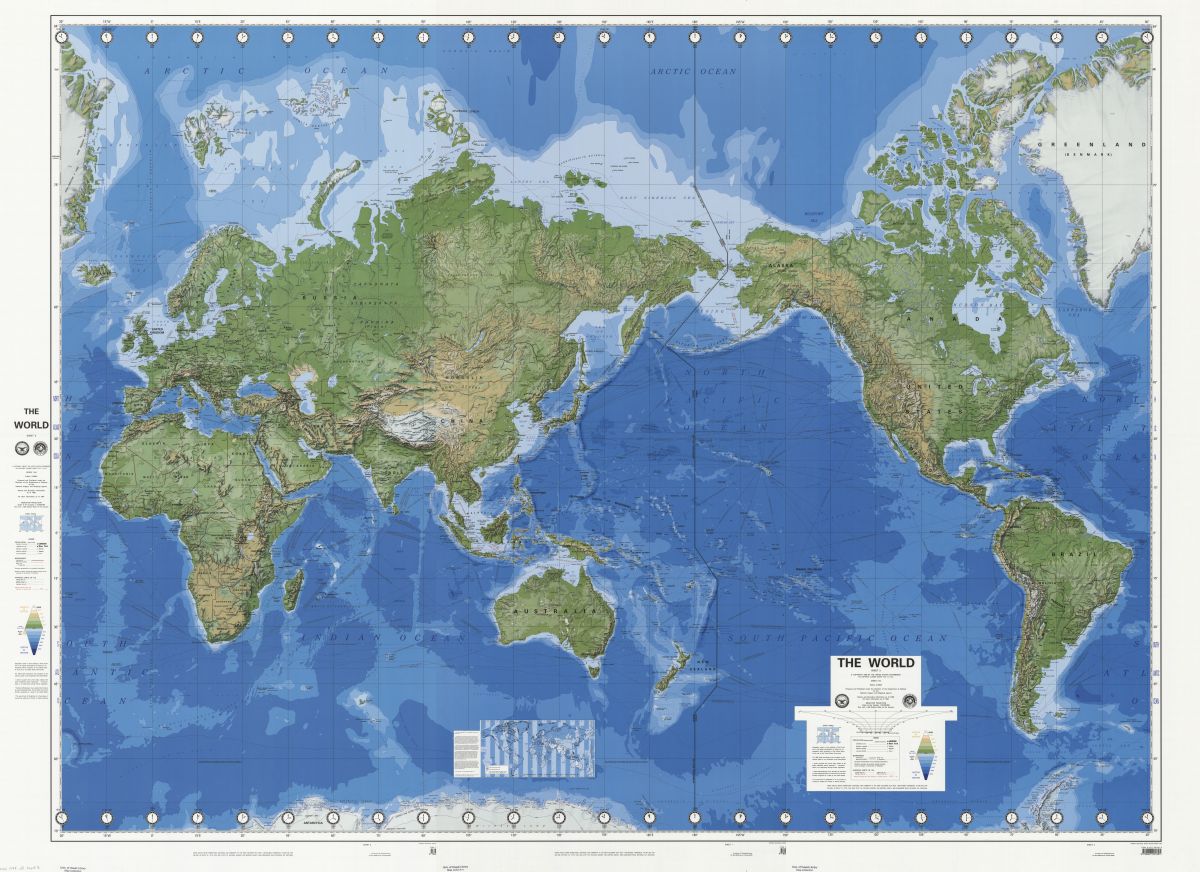
I first saw it in an atlas of the Solar System that I purchased inexpensively when it was remaindered, and later I saw a very large-sized copy of this map covering a wall at a local travel agency.
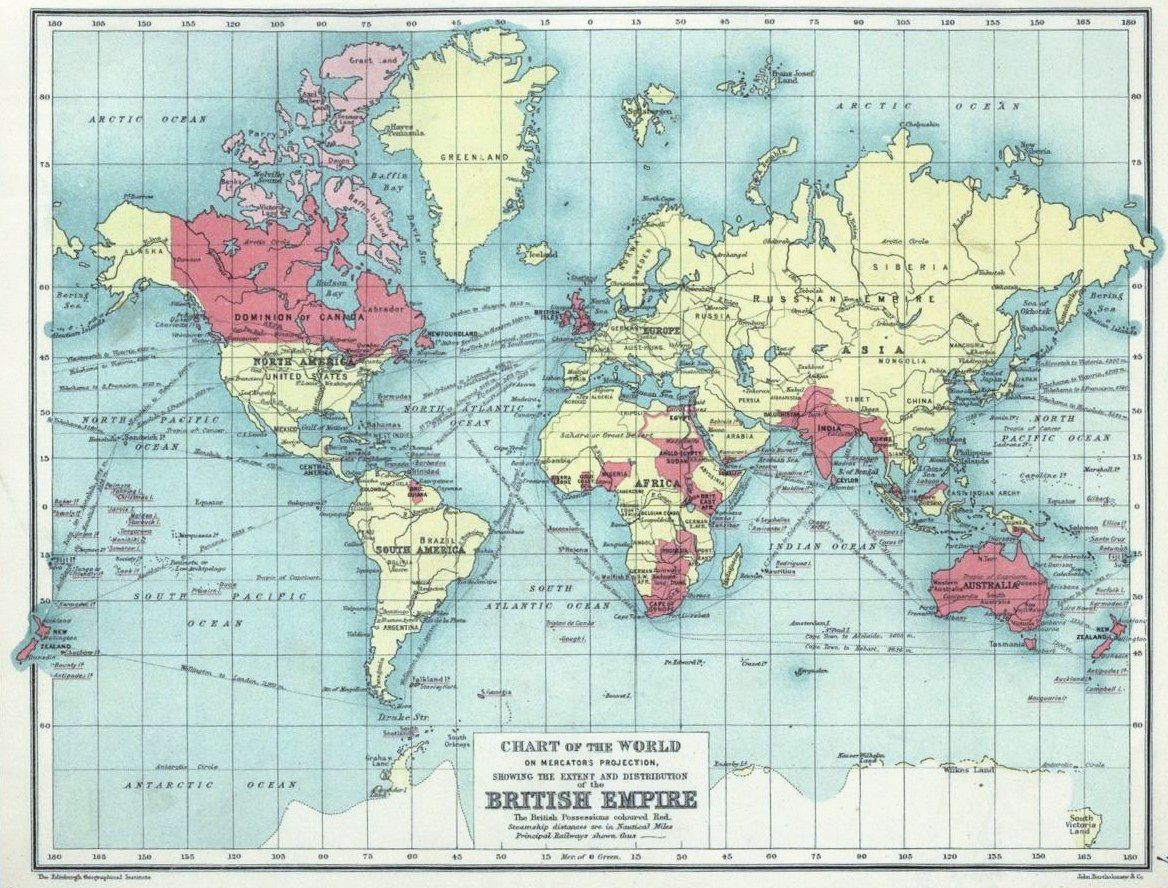
Sometimes, at least in older atlases, the Mercator projection is also used for maps of only part of the world. Here is an example from an atlas from 1914:
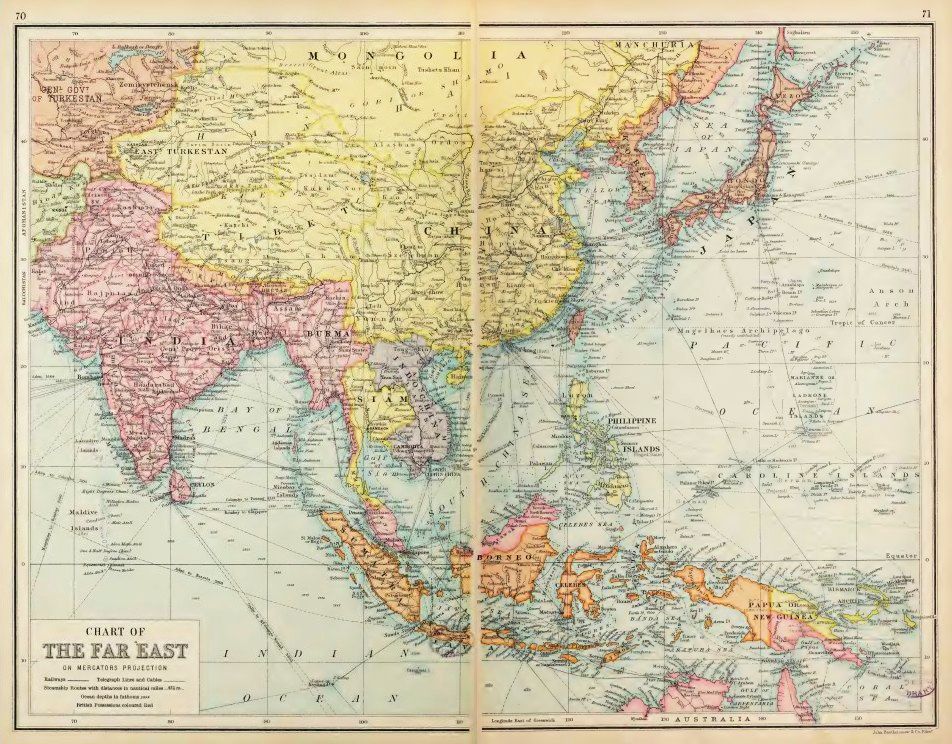
There are some interesting boundaries shown on this map. Although it may not be clearly visible at this size, Tibet is shown as including Qinghai, which area is referred to as Koko-Nor on this map. As well, Sinkiang province is referred to as East Turkestan on this map.
Although, unlike the Stereographic projection, it was not known to the ancients, it has been around a long time. Thus, here is a map on the Mercator projection from 1782:
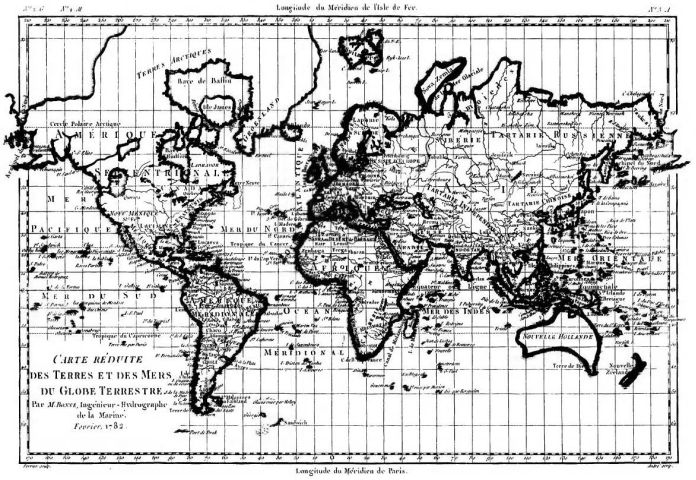
Along the top, longitudes from Ferro are given, along the bottom, those according to the Paris meridian are given.
And here's an image of Mercator's original map on the projection named after him, from the year 1569:
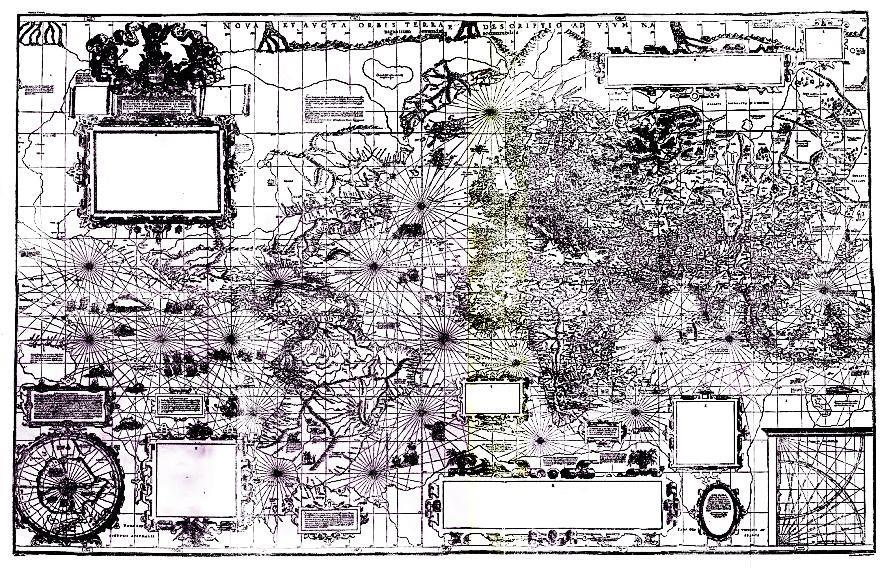
Note that several text boxes are blank in the illustration above; it is an illustration of a redrawing of that map for an encyclopedia. Here is an image based on an actual photograph of one copy of Mercator's original map:
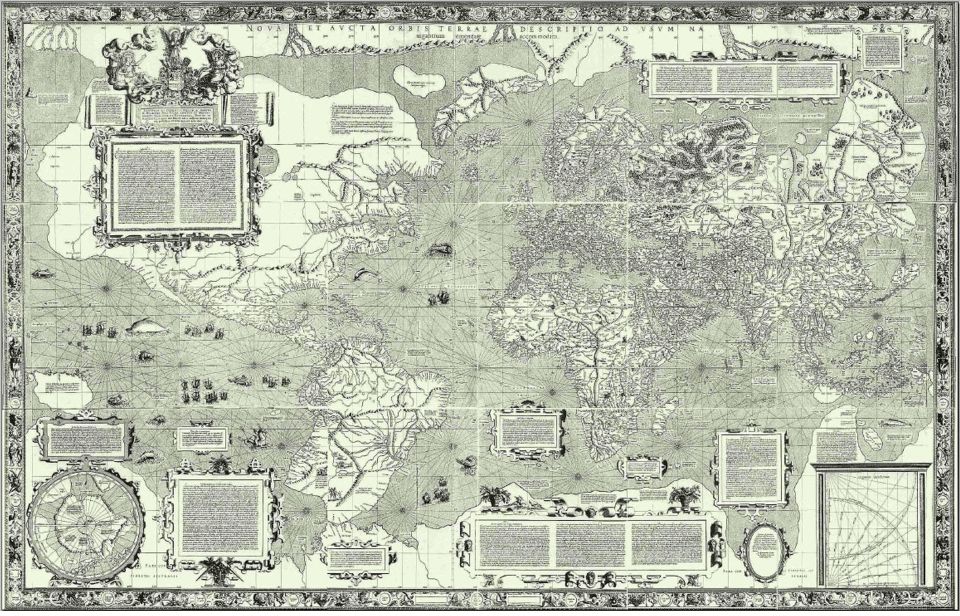
As can be seen from this image, Mercator's original map consisted of eighteen individual sheets in three rows of six.
Although it may look crude by today's standards, it stood head and shoulders above the maps of the world attempted before him, so much so that it can justly be recognized as the first modern map of the world, the first map drawn to be as accurate as possible with the information available at the time. Earlier maps looked like mere rough sketches in comparison, whereas this map is clearly highly detailed.
The meridian used for this map is based on the Cape Verde islands. Mercator also, as noted in Wikipedia, suggested as an alternate meridian one based on the island of Corvo within the Azores islands; but that island lies about six degrees (as drawn on Mercator's map) to the west of the meridian Mercator used, so being based on Corvo is not an alternative definition for the Azores meridian, as I first thought when reading the Wikipedia article.
On the assumption that Mercator's longitudes for continental Europe would be the most accurate, I saw from looking at one large image of his map that 30 degrees East passes through Wesel, a city between Arnhem and Duisburg (called Duysbourg on Mercator's map), and 20 degrees East passes through another city; at first, I thought it might be Rennes, but its relationship to St. Malo and especially to Nantes mean that I misread the name.
Wesel is at 6.63 degrees East longitude, and Rennes is at 1.68 degrees West longitude (plus, it's shown as lying to the West of Saint-Malo on Mercator's map, whereas it lies to the East of it, so perhaps I misidentified that city); as well, Mercator was Flemish, so Wesel would be closer to home for him.
However, it is reasonable to think that the longitude of a larger city, which is more likely to contain an observatory and so on, would be more accurately known. Paris, on Mercator's map, is shown as being at a longitude of 25.3 degrees West. That would place Mercator's standard meridian at 22.95 degrees West.
I even remember a small atlas, with a red plaid cover, that my mother recieved as a premium with a brand of flour, almost all of the maps of countries and continents in which were in this projection. (If I remember correctly, Canada got a simple conic projection: and, ironically, the world map was in a slightly modified form of the Mercator, where the extreme northern part of the map was divided into round caps. Also, on the back cover there was a map of air routes in an Azimuthal Equidistant centered on London.)
Having seen pictures of a few of the pages of that atlas now, printed by the Copp Clark company in 1950, I have found the reason for departing from the Mercator in the one place most atlases of the time used it. Rather than drawing a world map themselves, they licensed one from the Government of Canada, specifically the Department of Trade and Commerce. There were two pseudocylindrical caps, with the interruptions at 170 degrees West longitude, and at the Prime Meridian (so the two caps were unequal), and at about 55 degrees North Latitude, so they would just miss cutting Britain.
If one were to present it in a more balanced form, so that the Equator would be in the middle, it might look like this:
and now one can see the Antarctic coastline as well as the northern tip of Greenland.
This projection was so ubiquitous that it even gave rise to concerns that people were deriving their ideas of what the world was like from it, instead of from the globe.
Incidentally, it may not be too soon to address one common misconception about the Mercator projection. All mathematical schemes for drawing the Earth on a flat piece of paper are called map projections. Some of them, like the Stereographic, which we shall address later, can be visualized as being created by actually projecting areas drawn on a transparent globe to a plane with a beam of light, as this diagram shows:
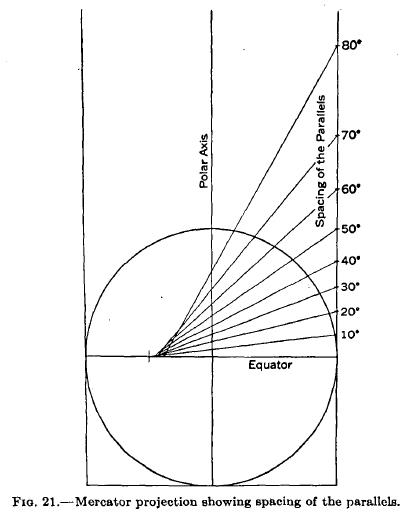
This is a specific type of projection, called a perspective projection. The Mercator projection is not such a projection, as this diagram illustrates:
The lines connecting the parallels of latitude on the globe to corresponding parallels on the map intersect the Equator at different points.
However, as that diagram also shows, a perspective cylindrical projection with the projection point being 3/4 of the radius of the Earth underground is a fairly close approximation to the Mercator projection. Unlike the Mercator, however, the poles would be at a finite height on that projection.
A more accurately-drawn diagram illustrating this, from Elements of Map Projections by Deetz and Adams, is this:
As a result of the fact that the Mercator map goes to infinity at the poles, and has accurate scale at the equator, and that, as we shall see, perspective projections are common in cartography, likely many people who had not thought much about the matter, and who haven't happened to read the correct answer somewhere, have the misconception that the Mercator is a perspective projection with the projection point at the Earth's center. That is definitely not the case:
The projection formed that way looks like the image above, with far more vertical exaggeration towards the Poles than even the Mercator.
What made it so popular, and so seductive?
As you can see, as with any cylindrical projection in the normal case, the meridians and parallels are all straight lines. That made it easy to draw. But because of the way the parallels are spaced, every part of the map looks natural. Nothing seems to be streched or twisted, the way it sometimes is on other popular projections.
This is because the Mercator projection is conformal. Because it is conformal, nothing can be stretched unequally in different directions, or sheared, anywhere on a map drawn in that projection.
Why is Greenland so gigantic on the map? Because it has been stretched in the vertical direction exactly enough to compensate for the stretching it must recieve in the horizontal direction on any cylindrical projection.
On the globe,
as this diagram illustrates, the radius of every parallel of latitude is proportional to the cosine of the latitude. This means that the circumference of those parallels follows the same law, and thus the length of a degree of longitude along any parallel of latitude is proportional to the cosine of the latitude as well.
On a cylindrical map, however, the length of a degree of longitude remains the same from the top to the bottom of the map.
Thus, since at a given latitude, horizontal stretching by a factor of one over the cosine of the latitude takes place, vertical stretching of a factor of one over the cosine of the latitude must also be performed.
Thus, the formula for the positions of the parallels in a Mercator projection can be looked up in a table of integrals:
     _n
    /
   |     1                  1                                 n         -1
   |  --------, dx = ln( -------- + tan(n) ) = ln( tan( 45° + - ) ) = gd  (n)
   |   cos(x)             cos(n)                              2
 _/
  0
And this formula even works when n is negative, representing southern latitudes.
Mercator himself did not use this formula, it was worked out later, around 1590, by one Edward Wright.
Note the last way of expressing this formula: the height of the parallel for a given latitude, when that latitude is expressed in radians, equals the inverse Gudermannian (also known as the Lambertian) of that latitude.
As the Gudermannian is defined as:
           -1
gd(x) = sin  (tanh(x))
the Lambertian, or inverse Gudermannian is also:
  -1          -1
gd  (x) = tanh  (sin(x))
Note that raising the sine function to the -1 power is a notation for the inverse function, or the arc sine, whereas squaring the sine squares the value rather than composing the sine function with itself, here, following conventional mathematical notation, despite the potential for confusion. |
Given that:
   2       2
sin x + cos x = 1
and
    2        2
sinh x - cosh x = -1
or, perhaps, more relevantly,
    2        2
tanh x + sech x = 1
it is possible to establish that the Gudermannian connects the hyperbolic functions to the trigonometric functions in other ways as well. Thus, the Gudermannian can be expressed in all of these ways:
          -1            -1            -1
gd x = sin  tanh x = cos  sech x = tan  sinh x
as well, as, trivially, because the cotangent is the reciprocal of the tangent, and the secant is the reciprocal of the cosine and so on,
          -1            -1            -1
gd x = csc  coth x = sec  cosh x = cot  csch x
which, among other things, allowed the G sub theta scale, in conjunction with trig scales (and another scale for converting from radians to degrees), on the Hemmi 153 slide rule to be used to determine hyperbolic sines, cosines, and tangents.
Returning to the question of why the Mercator projection had been so popular, reading about its use by Google Maps led me to recognize what was perhaps the most important reason for that.
While some wall maps have big and bold printing on them, others are very detailed, so that it would not be possible to read the names of cities on the map if one were standing far enough away from it to see the map as a whole.
Since the projection is cylindrical, North is at the top everywhere on the map; since it is conformal, smaller areas on the map are close to being completely correct, and so, a detailed Mercator wall map on a large scale can function as an atlas that can be consulted by many people at once; back when color printing was expensive, and schools had considerably smaller budgets than they do nowadays, a map that could take the place of supplying each student with his own atlas made a great deal of sense.
One student could use be looking at France, another at Madagascar, and another at Australia, and all of them would be seeing reasonably useful maps of those areas.
In fact, you could put it in the form of an advertising slogan:
Mercator: the map that's an atlas you can hang on your wall!
And that, of course, is also the basic reason why the Mercator projection was ideally suited to Google Maps. You could zoom in to any place, except the North or South poles, without the need to redraw the map on a new projection.
Because angles are correct at every point on a conformal map, all the compass directions from any point make an equally-spaced circle at each point. On the Mercator, which is a map on a cylindrical projection, in the normal case north is always up. This means that, in the normal case, the Mercator has another important property: compass directions are correct everywhere on it.
This property has made it extremely useful for navigational charts used by ships. A line of constant compass heading is termed a loxodrome, and on the Mercator projection, all loxodromes are straight lines throughout their length.
Sometimes, critiques of the Mercator projection will say that since Mercator designed this projection with the intent of devising a projection having that property, which was so useful to navigators, which is true in itself, that he never intended for it to be used for anything else, and it was therefore, presumably, only sheer inexplicable and inexcusable laziness that led to its widespread use in wall maps and atlases afterward.
We've already seen above why this just isn't true. Conformality is a very desirable property of a map, and consistent compass directions is a convenience as well. The relative scale of different parts of the map differs, but each individual part of the map is shown correctly; so a map on the Mercator projection was often seen as the next best thing to a globe. It's only more recently that the equal-area property became important for world maps. This started, though, long before equal-area projections were advocated on grounds of justice and equity; first, world maps on equal-area projections were used whenever a map was displaying statistical information for the whole world.
However, it is a great circle that is the equivalent to a straight line on the globe, the shortest distance between two points. Going north or south, or east or west along the equator, the two are the same. Going east or west anywhere else, parallels of latitude are the loxodromes, and they are small circles, not great ones. Loxodromes in other directions are a type of spiral on the surface of the sphere, somewhat analogous to a logarithmic spiral. So, while the Mercator map was the navigational chart for the age of sail, the Gnomonic projection, which we will see later, is the navigational chart for the air age.
But the fact that only the conventional aspect of the Mercator projection shows loxodromes as straight lines doesn't mean the Mercator projection is not useful in other cases.
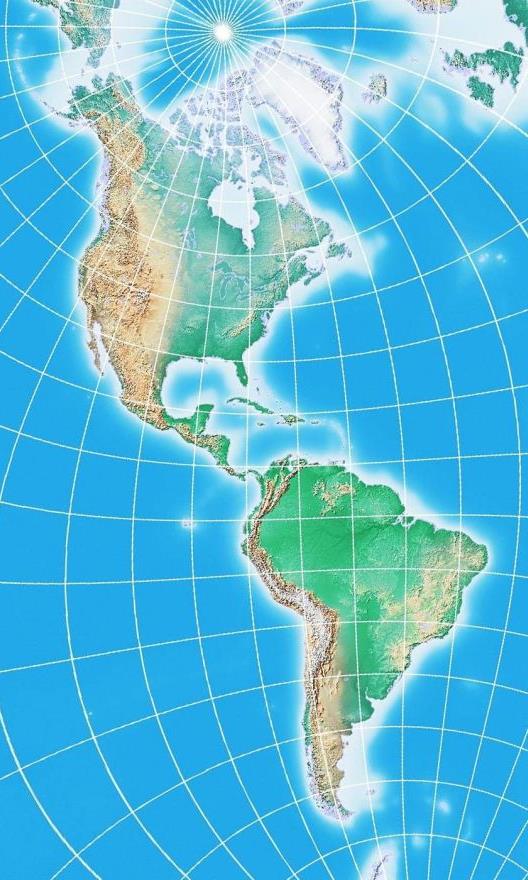
In the oblique case, for example, a Mercator projection like this:
can serve as the source for an attractive map of North and South America, since, as can be seen from the map above, those continents are both crossing the map's equator, the line of minimum distortion, which is shown as a line in red on the map.
On the right, we see the portion of that map containing the Americas, rotated 60 degrees clockwise. Both the Oxford Canadian School Atlas and some larger atlases produced by Oxford under their name contained a conformal relief map of the Americas on a similar projection.
A map projection which provided a further reduction in error for the Americas was based on the Lambert Conformal Conic, using two conic projections which were then stiched together by means of a small section which departed from strict conformality. This projection, the Bipolar Oblique Conic Conformal, has been deservedly acclaimed, but because of the complexity of dealing with that small area where its two segments are joined, I have not included a drawing of it on these pages, although a description is now included on my page about the Lambert conic conformal.
Thanks to G.Projector, I am now able to include on these pages a more pictorial representation of this beautiful projection: as it does not provide for an oblique version of the Mercator, but it does provide for an oblique version of the Equirectangular, which it takes as input, I have created this in two passes, plus some subsequent editing in paint programs:
The Transverse Mercator, also called the Gauss Conformal, is useful for star maps of the kind that show how the sky appears at a particular time on a particular day of the year, because the resulting map can be equally useful for people who live at any latitude.
It is fitting that Karl Friedrich Gauss concerned himself with a projection useful for astronomy, as he is also the designer of the Orthoscopic eyepiece, a design still considered ideal for planetary astronomy, due to its extremely low distortion.
The simple form of the Transverse Mercator projection, however, was invented by Lambert. Gauss is responsible for developing the mathematical theory of adapting the Transverse Mercator to the ellipsoid. While one can take the Transverse Mercator, like any other conformal projection, and make it into a conformal projection for the ellipsoid by substituting in equivalent conformal latitudes, this would mean that scale along the central meridian is not uniform. To retain that important property for a Transverse Mercator on the ellipsoid required a different approach. The resulting projection is also known as the Gauss-Krüger projection, as series expansions for computing the projection were later developed by (Johann Heinrich) L(ouis) Krüger. Much later, E. H. Thompson worked out, but did not publish, exact equations for the Transverse Mercator on the ellipsoid which made use of elliptic integrals. These equations are available, though; for example, they appeared in the monograph by L. P. Lee.
The Transverse Mercator is also currently popular for very large-scale maps. Why is this, when it would seem that the simplest possible projections would suffice, such as the simple conic, the Mercator in normal case, or even the Azimuthal Equidistant?
The reason for the popularity of the Transverse Mercator, and for the previous popularity, as an approximation, of the Polyconic and related projections is because even on a large-scale map, there are slight errors because the map is flat and the Earth is round.
If the Azimuthal Equidistant were used for each map, at least each map would be on the same projection as each other map, and so one set of tables for the corrections needed could be used.
On the other hand, it is also desirable to be able, as far as possible, to allow adjacent maps to be joined together. This can be done in one direction. The simple conic will allow this horizontally, but it is a different projection for each standard parallel.
The Transverse Mercator combines both advantages: maps made in that projection can join up vertically, and any part of the Earth can be made to pass through its standard meridian, so every place can be mapped using the same projection. In practice, the actual printed maps used are segments of a larger map, sharing a common standard meridian. This increases error, but the correction tables needed still only need to cover a very narrow horizontal strip, and doing so allows a grid coordinate system to be used over a larger area.
In the case of the oblique Mercator, the currently most popular version of the oblique Mercator projection for the ellipsoid is due to Brigadier Martin Hotine in 1947, and is called either the Rectified Skew Orthomorphic Projection or the Hotine Oblique Mercator. Even this version, however, does not have uniform scale along the Equator in projection coordinates, but unlike the Rosenmund Oblique Mercator, it does attempt to closely approximate equal scale, which is why it is currently preferred.
The earliest form of an Oblique Mercator for the ellipsoid was proposed in 1903 by Max Rosenmund; this simply used the conformal latitude derived from the conventional Mercator for the ellipsoid, so that an Oblique Mercator for the sphere could be modified to be a conformal mapping of the ellipsoid, but without uniform scale along the Equator of the projection.
A considerably more complicated version of the Oblique Mercator was developed in 1928 by Jean Laborde for use in the mapping of Madagascar.
Before we begin to discuss drawing maps based on the ellipsoid, one elementary fact about latitude on an ellipsoid needs to be known. When the location of a place is given in terms of its latitude and longitude, the ordinary latitude normally used for that purpose is referred to, technically, as that location's geodetic latitude. And it has a specific definition, which is illustrated by this diagram:
The geodetic latitude is not determined by taking the angle from the center of the Earth, as one might naïvely think; this quantity also exists, and is called the geocentric latitude, and is used for some purposes.
Instead, it is defined in terms of a very common means of determining latitude - it equals the minimum angle between a line from the point in question which goes towards the North point in the sky (close to, but not exactly at, the location of the North Star, Polaris) and a plane tangent to the geoid (rather than the Earth's surface, strictly speaking, or one's latidude would be very different on opposite sides of a hill) at that point. Wait a moment, since the geoid is an imaginary surface, how do we find where it is if we're just getting started determining the latitudes of places? A plane tangent to the geoid is also a plane perpendicular to the local vertical, and so a plumb bob will suffice to determine a plane oriented in the correct direction, if not at the correct height, so that is how that problem is dealt with.
Actually, the diagram might suggest another question. Even if the Earth's surface is an oblate spheroid, bulging out like that, wouldn't gravity still pull towards its center, rather than "down" actually being perpendicular to its local surface, as this claim that one can get away with using a plumb bob seems to assert? The answer to that question is well-known to astronomers. The Earth is quite large. So large, in fact, that the solid rock of which it is made behaves (at least on the largest scales; we can still have mountains and valleys), in response to such forces as its own gravity, and the centrifugal force created by its own rotation, as though it were liquid (particularly if you wait long enough, and the Earth has been spinning for geological ages). Thus, the apparent local force of gravity acting on one's plumb bob also includes a component due to that centrifugal force... thus, "down" is perpendicular to the surface of the Earth, although it is an oblate spheroid, precisely because of how it got that way. This principle is illustrated below:
where the red arrow below the plumb bob, pointing towards the center of the Earth, represents the component of the forces acting on it due to gravity, the green arrow represents the additional force due to the centrifugal force from the Earth's rotation, and the blue arrow represents the resultant of those two forces, which leads to the plumb line being pulled down in a direction perpendicular to the surface of the ellipsoid.
And, of course, one might remember as well that the geoid is defined in terms of mean sea level, and the ocean actually is liquid, on small scales as well as large, and so if your plumb bob is not perpendicular to its surface, you must be riding a wave.
Just as a perfect sphere is only the first approximation to the shape of the Earth, an ellipsoid, while a much more accurate approximation, is still not the exact basic shape of the Earth (that is, not counting hills and valleys, but only the shape of the geoid, which is determined by complicated technical methods rather than by putting nilometers everywhere). One way in which this is taken into account is for different reference ellipsoids, that best approximate the shape of the geoid in a given area, even though they are not the best approximation to the overall shape of the Earth, to be used for the mapping of different countries.
Since the flattening of the Earth is about one part in 298, one could actually depict the Earth's oblateness to scale by an ellipse 596 pixels wide and 594 pixels high, that would easily fit on these pages, although its deviation from a circle would hardly be noticeable. 1/298th of the radius of the Earth is about thirteen miles or twenty-one kilometers; the deviations of the geoid from the ellipsoid, on the other hand, are on the order of 20 yards or 20 metres at most, so the more complicated shape for the Earth is once again a small refinement to what was the earlier approximation, not an overturning of it. Naturally, in the illustrations above, an ellipse with a much greater flattening was shown for clarity in the diagrams.
I remember when I was young reading that scientists had discovered that the Earth was not an ellipsoid as formerly believed, but instead pear-shaped. As noted above, it would be more accurate to say that the Earth was a slightly imperfect ellipsoid with some pear-shaped tendencies, but things get oversimplified. Now the term "pear-shaped" is no longer much used, because the deviations of the geoid from an ellipsoid are known to be much more complicated.
It took a bit of searching, but I found out how that particular term for the shape of the geoid, much beloved by the news media (apparently even Neil de Grasse Tyson has used it, making him shockingly out of date) got started. Observations of the first successful American space satellite, Vanguard I, gave us our first intimations of the additional complexity of the figure of the Earth.
Specifically, a paper in the February 27, 1959 issue of Science, titled Vanguard Measurements Give Pear-Shaped Component of Earth's Figure (see, they referred to it as simply a part of the Earth's shape, not something that overwhelmed its basically ellipsoidal shape) by J. A. O'Keefe, Ann Eckeis, and R. K. Squires.
Incidentally, while the values for the Earth's flattening were determined from detailed surveys, knowing the size of the Earth, the strength of its gravity, and the length of the sidereal day, it is possible to work out from first principles what the Earth's shape should be: this gives 1/f as about 289, which is at least close to the observed figures, if not an exact match: the Earth is slightly closer to a sphere than one might expect.
It was noted above that geodetic latitude is determined by the geoid, not the surface of the ground, because if it were determined by the surface of the ground, there would be absurd results, as latitude would be different depending on which side of a hill you were on. Well, the same thing applies to geodetic longitude. And if the geoid is bumpy, then, while hills don't make latitude and longitude do strange things, bumps in the geoid do.
What if the Greenwich Observatory were located on the side of a bump in the geoid?
Well, it is. That is why the IERS Reference Meridian, which is a meridian of geocentric longitude instead of geodetic longitude, passes about 5.31 seconds of arc east of the transit circle in Greenwich upon which the Prime Meridian had originally been based. A geocentric coordinate system, which can then be easily converted to any ellipsoid, is much easier for the GPS system to tell you your location in than actual geodetic coordinates based on a bumpy and complicated geoid. And changing the longitude of the Greenwich Observatory based on the characteristics of its local geoid doesn't mean the longitude of everywhere else is changed by the same amount: instead, it means that the changes, over the world, based on the local slope of the geoid, average out to zero, and are thus kept to a minimum.
The Mercator projection, in its conventional aspect, represents a simple enough case that it is possible to express the formula for the ellipsoid here.
And if we invert the mapping back to the sphere, we have a conformal mapping from the ellipsoid to a sphere that can be used with any other conformal mapping, so that it is now conformal for the ellipsoid. (In some cases, such as the transverse Mercator, other methods are often used to modify the projection for the ellipsoid in order to preserve other properties in addition to conformality. But I only propose to deal with the simplest case here.)
We saw, above, the formula for the spherical Mercator, where n is the latitude:
                 n
  ln( tan( 45° + - ) )
                 2
Of course, it is multiplied by a constant representing the scale of the map.
For an ellipsoid, the formula changes to:
                                          e/2
                 n        1 - e * sin(n)
  ln( tan( 45° + - ) * ( --------------- )    )
                 2        1 + e * sin(n)
Since raising a number to a power is a complicated operation, and we're already taking a logarithm, the formula can be modified to:
                1 - e * sin(n)                    n
  (e/2) * ln ( --------------- ) + ln( tan( 45° + - ) )
                1 + e * sin(n)                    2
The constant e stands for the eccentricity of the ellipse which is rotated to form the ellipsoid.
Usually, the shape of the terrestrial ellipsoid is stated in terms of a number like 297 (the 1924 International Spheroid) or 298.25 (WGS 1966, the 1967 International Spheroid). This number is the reciprocal of the flattening: that is, the minor axis of the ellipse is 1/297 or 1/298.25 of the major axis of the ellipse shorter than the major axis of the ellipse.
Thus, call this number g, since it is 1/f where f is the flattening.
The eccentricity is equal to sqrt( 1 - ( 1 - 1/g )^2 ), or sqrt( 2/g - (1/g)^2 ).
While the ellipsoidal formula might not be invertible, the spherical one certainly is, so we can easily go from n, the geodetic latitude on the ellipsoid, to n', the equivalent conformal latitude on the sphere, and continue drawing a large-scale conformal map.
While using the conformal latitude, as it is termed, is the simplest way to make any projection conformal for the sphere also conformal for the ellipsoid, in the case of the Transverse Mercator, this loses one other property of the projection that is important, the fact that scale is uniform along the central meridian of the projection. Thus, the great mathematician Karl Friedrich Gauss worked out how to retain uniform scale on the central meridian, and retain conformality in the Transverse Mercator for the ellipsoid by other means.
Thus, instead of conformal latitude or geodetic latititude, that being the distinctive name of the actual latitude of places, what has to vary uniformly along the central meridian of the map is called rectifying latitude. So what happens off the central meridian must vary.
Incidentally, at least one other projection, the conformal polyconic, would need the same transformation applied to it as the transverse Mercator.
The true Transverse Mercator for the ellipsoid is quite complicated. However, one mathematical approach to it is at least somewhat understandable.
As noted, one could take the transformation used for the ordinary Mercator, using the conformal latitude instead of the geodetic latitude, on the Transverse Mercator as well. One would get a conformal projection, which is a kind of Transverse Mercator, but the scale on the meridian isn't uniform.
There are formulas for converting back and forth between the conformal latitude and the geodetic latitude, as we've seen above, and there are also formulas for converting back and forth between the geodetic latitude and the rectifying latitude.
So why don't we use these formulas, but on complex numbers instead of real numbers?
A differentiable (analytic) complex function specifies a conformal mapping. So distance away from the central meridian becomes the imaginary part of the latitude to be converted from conformal to rectifying... and we get the desired form of the Transverse Mercator. This insight is given in the paper Transverse Mercator with an Accuracy of a Few Nanometers by Charles F. F. Karney.
In fact, E. H. Thompson worked out, using elliptic integrals, an exact solution for the Gauss-Krüger projection.
The inverse formula for a modified Transverse Mercator for the ellipsoid, which is called the Thompson Conformal Projection, although it is only used as an intermediate step in the calculation, and not to draw maps in that projection itself, is:
                    -1                         -1
lat + i * lon = tanh   sn( u+iv, k ) - k * tanh   ( k * sn( u+iv, k ) )
where the modulus, k, is set equal to the eccentricity of the ellipse which is rotated to make the ellipsoid.
The exact Gauss Transverse Mercator is then calculated from u and v by the equations:
                       -1
alpha + i * beta = tanh   sn( u+iv, k)

x + i * y = alpha * ed( u+iv )
where the second equation can be expanded to give
                          2
                         k sn(u,k) * cn(u,k) * dn(u,k)
x = alpha * ( en(u,k) - ------------------------------- )
                           2           2
                         dn (u,k) + dn' (v,k) - 1

                                2
                              k' sn'(v,k) * cn'(v,k) * dn'(v,k)
y = alpha * ( v - en'(v,k) + ----------------------------------- )
                                2           2
                              dn (u,k) + dn' (v,k) - 1
where k' is derived from
         _______________________
        /   2         2  2
k' =   /  dn (w,k) - k cn (w,k)
     \/
and w = u + iv.
The function en(u) is a Jacobian elliptic function related to the elliptic integral of the second kind, and can be defined as:
             _ u
            /      2
en(u,k) =  |     dn (q,k), dq
         _/
            0
In practice, it is still so complicated that one has to be content with polynomial approximations to the projection, but these polynomials can be computed far enough to achieve any reasonably needed accuracy for an ellipsoid so nearly spherical as the Earth.
As noted above, the actual shape of the geoid is more complicated than an oblate spheroid or ellipsoid. This has led to the problem depicted below in this diagram from "Geodesy for the Layman", a (United States) Defense Mapping Agency Technical Report:
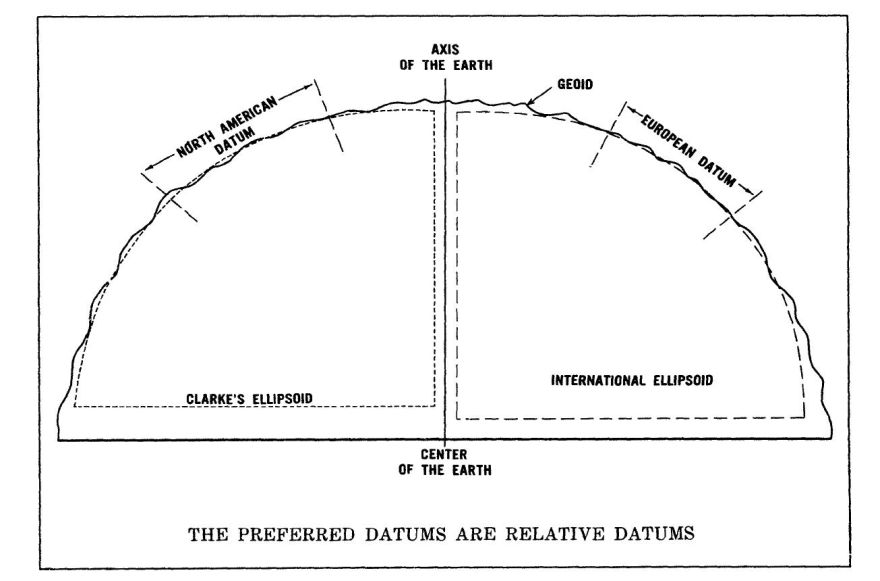
Different countries or regions will use different ellipsoids as the basis of their large-scale mapping as those are the ones which are the best fit to the portion of the geoid over which they are conducting that mapping.
Incidentally, the ellipsoid considered ideal for North America is the Clarke ellipsoid of 1866, where the Earth is flattened by one part in 294.9786982, rather than the Clarke ellipsoid of 1880, which was rounded off to 293.465.
This leads to a mismatch with the potential for confusion, so it's been recommended that the world agree on one system involving an ellipsoid which is the best fit for the Earth as a whole.
In a way, that's a step back, as the point of drawing maps based on the ellipsoid instead of the sphere is so that those maps will be as accurate as possible a representation of the local area they cover.
An alternative has come to my mind. The shape of the geoid is quite complicated, so it would be impractical to adapt map projections to the geoid the way they are adapted to the ellipsoid.
But instead of choosing an ellipsoid that is the best fit to a large area like Europe or the United States, and thus having large changes at boundaries, why not draw every map sheet (or every small group of map sheets, as often several map sheets across will share the same central meridian) on the basis of the ellipsoid which is the best fit to the area in that particular map sheet?
Of course there will now be discrepancies all over the place between adjacent map sheets, but they will be very tiny ones, with the changes small and gradual instead of large and sudden. In this way, instead of mapping to a compromise world ellipsoid, mapping would be done - as nearly as is practical - to the geoid itself.
Of course, no doubt there are many professionals with expertise in geodesy who could tell me just why this is a terribly bad idea, but it seems reasonable based on what I've heard of the issue.