This projection, also known as the Sanson-Flamsteed projection, and the Mercator Equal-Area projection, is the simplest pseudocylindrical equal-area projection.
As we saw previously,
the width of a degree of longitude is proportional to the cosine of the latitude. Hence, if we space the parallels of latitude uniformly on the map, and make the scale of longitude always proportional to the cosine of the latitude, areas will be correct.
However, as you can see, continents distant from the prime meridian are sheared, giving them a very distorted appearance in this projection.
Since the scale on the Equator is uniform, and the meridians cross it at right angles, and the vertical scale of the projection does not change along the equator for different longitudes, it is possible to considerably reduce distortion with this projection by using an interrupted version of it.
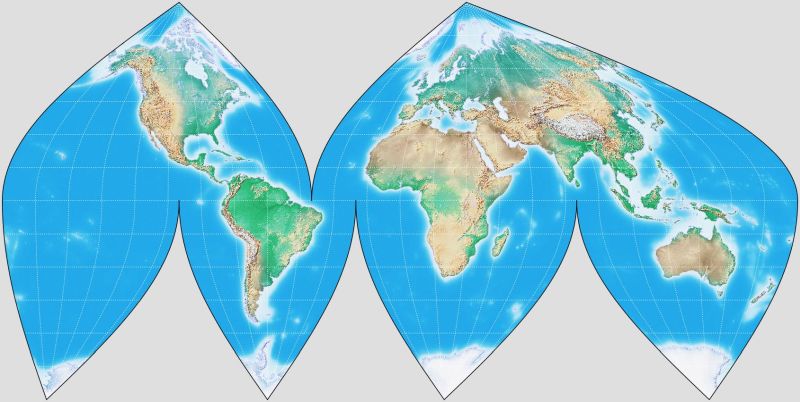
The image above is an example of an interrupted sinusoidal projection.
While the Sinusoidal projection had been used to draw maps as far back as the year 1570, the idea of using an interrupted Sinusoidal projection was first proposed by J. Paul Goode, who later devised the Goode Homolosine projection, in 1916.
From the September, 1929 issue of Popular Science magazine, as shown by the image of part of it below:
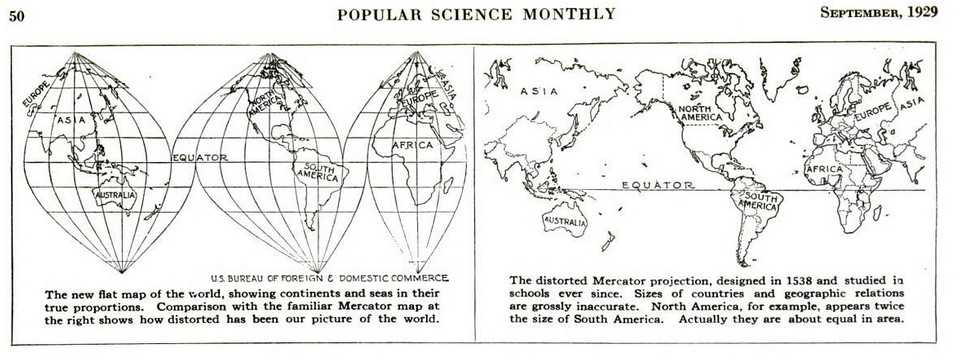
we can see that it has long been the case that the large inequalities of scale in the common Mercator projection were recognized as misleading, and an equal-area map projection advocated as a superior alternative.
And in my opinion, an interrupted Sinusoidal projection is a far better choice of an equal-area projection than the Peters projection. However, the Peters projection, being cylindrical, makes a map that is rectangular in shape, thus filling the page and allowing the map to be on a larger scale, so, despite its extreme distortions of shape, it does have one advantage.
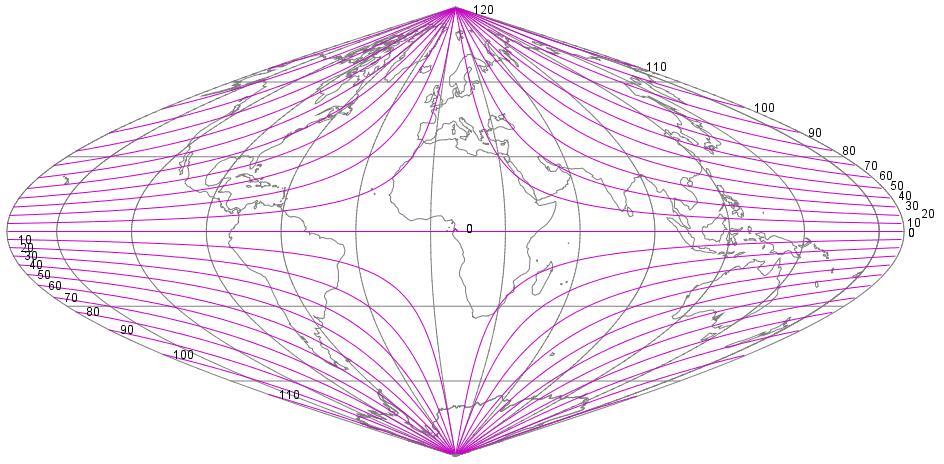
The scale of the Sinusoidal projection is true along both the Equator and the prime meridian. This property is preserved, at least for half of the Equator, if we consider the transverse aspect of the Sinusoidal projection as well:
The shape of South America suggests that an oblique Sinusoidal projection might be useful in producing an equal-area map of South America with low angular distortion.
Thus, if we orient the globe so that the Equator goes through Argentina, and the Prime Meridian goes through Brazil and either Peru or Colombia, something like this:
by tilting the North Pole forwards by 77 degrees down along the meridian of 32 degrees East longitude, and then assigning that meridian to 95 degrees East longitude on the map, the resulting map of South America could look like this:
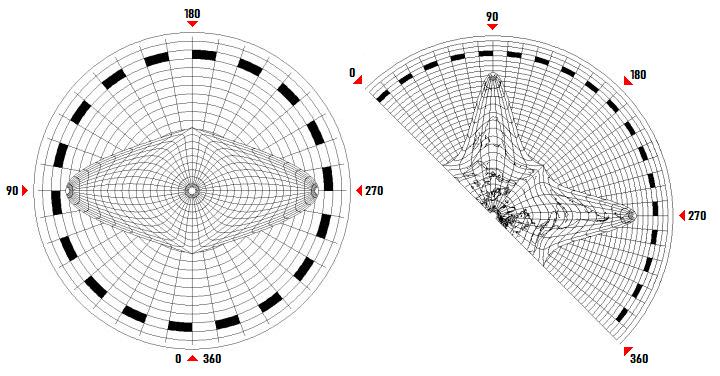
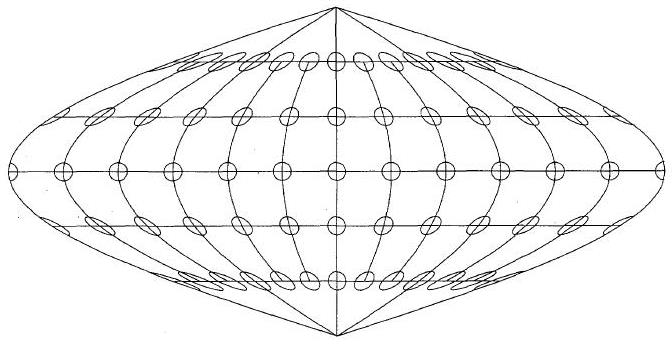
The Sinusoidal projection is attractive in its conventional aspect because scale is preserved along the central meridian and the Equator. But this comes with a price; since errors remain low in two directions from the central point, in other directions error tends to be higher away from the center, compared to the Lambert Azimuthal Equal-Area projection. That is illustrated by the following diagrams:
This one illustrates the Sinusoidal:
And this one illustrates the Lambert Azimuthal Equal-Area; the graticule is shown for the projection centered on a pole, so it must be noted that the parallels are spaced by 30 degrees, like the meridians:
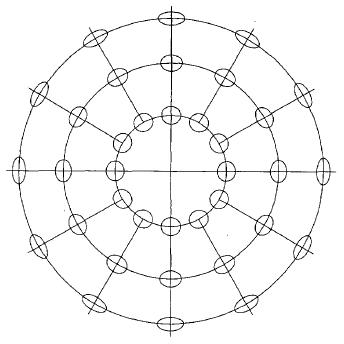
The small ellipses shown centered on various points illustrate the error, as their size and shape corresponds to how the map represents scale in all directions at those points. An ellipse like that is called a Tissot indicatrix, and forms the basis of the theory of error in maps.
These illustrations, plotted by computer, are from An Album of Map Projections, U. S. Geological Survey Professional Paper 1453, by Voxland and Snyder.
For the Sinusoidal, at least, thanks to the program Flex Projector, I can supply a different kind of diagram showing how angular distortion is distributed on the projection that makes it clearer what is going on:
Although that program is specialized in nature, handling a certain category of projections, so that it could not directly generate a similar diagram for the Lambert Azimuthal Equal-Area projection, I was able to get the information I needed to draw one:
But the Sinusoidal has a property that not many other projections have.
Look at the Eckert IV projection, another equal-area projection:
You can see that Greenland is too wide for its height, and Africa is too tall for its width. You can see that... because you've seen what those places look like on a globe, or on another map.
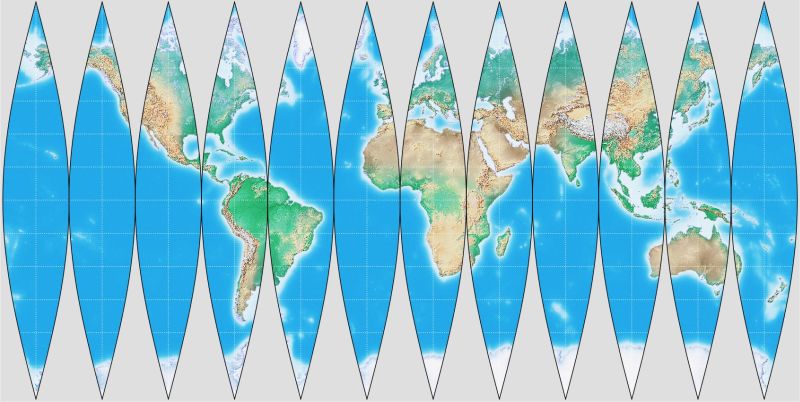
Now take another look at the Sinusoidal:
Here's an interrupted Sinusoidal in a commonly used form. Eurasia isn't cut in half, so Japan, for example, doesn't fare very well.
Of course, if you cut a map into enough tiny pieces, it can all have low distortion,
but that, in itself, isn't very exciting.
However, let's compare two small pieces of these two versions of the Sinusoidal:
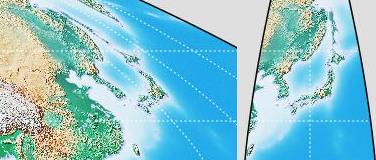
There's a relationship between them. If you look at the map where Japan is badly sheared, you can tell, just by looking at that map itself, what's wrong with it, and what needs to be done to fix it. Push it over so that it stands straight.
Because of the way the distortion interacts with the graticule, in the conventional orientation of the Sinusoidal, it's all "shear" and no "stretch". Of course, shear and stretch are just both names for the same underlying phenomenon, angular error, so for many purposes the distinction is irrelevant and misleading.
But the interaction between human beings and maps involves subjective elements, and the graticule is a guidepost that matters for some projections.
Thus, the angular distortion in the Sinusoidal, I claim, is less pernicious, because it is possible to mentally adjust to it and correct it. The projection itself tells you what kind of error it has, and by how much it is in error.
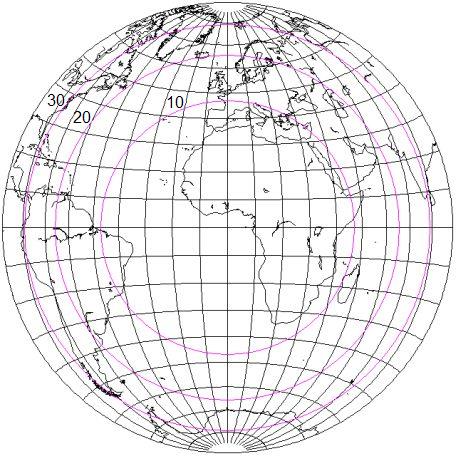
Another projection that is "self-correcting", but in a different way, is the Orthographic projection:
As a flat map, the distortion increases faster as you go from the center to the edges than on the Lambert Azimuthal Equal-Area, for example.
But when you look at this, you don't see a flat map, you see a picture of a globe. So you know that parts of the globe, because it's round, are tilted away from you, and you can tell what they would look like if they faced you directly.
Since it is impossible to make maps of the spherical Earth on a flat piece of paper without error, and without significant error for any large area, a map projection that, while it has error, lets you mentally correct for it, and see truth on the globe despite those errors is worth considering.
On the next page, we will look at Bonne's projection. In the way it is usually used, for an atlas map of a continent, it isn't obvious that you could straighten out distorted areas in the same way as with the Sinusoidal - while looking at an interrupted Sinusoidal map of the whole world, like the ones on this page, tends to give away the secret.
But if people were told what to look for, they could do this with the Bonne. Perhaps it could make a comeback.
On further reflection, regarding the Bonne as a special case of the Sinusoidal rather than a separate projection in its own right, I think I have found a third example of a projection that distorts, and yet does not deceive.
The Mercator projection, in its normal aspect, is of course deceptive:
One can sort of guess that Greenland is probably bigger than it should be, but one has no way of knowing by how much.
But what about the Transverse Mercator?
If we grant that it is "obvious" that on the Equator of the projection, which is the central meridian of the transverse case, everything is depicted as it should be... then, for the quadrangles of latidude and longitude further out on the map, where areas are enlarged, it is clear and obvious that the amount by which the territory depicted is enlarged... is the amount by which the quadrangle of latitude and longitude in which it resides is enlarged relative to one like it on the central meridian!
So this is another example of a projection that, although it distorts, provides an immediate guide, within the meridians and parallels of the map itself, to exactly how much distortion is present.
In fact, it's possible to go further. If a quadrangle of latitude and longitude can be either distorted in shape to make it look like one on the central meridian, in the Sinusoidal, or distorted in size to make it look like one on the central meridian, in the Transverse Mercator, then if both distortions in shape and size are present, why can't the area be mentally adjusted in both respects?
So perhaps the Polyconic ought to be added to the list of self-correcting projections. Or Cassini's projection (the transverse case of the equirectangular). Or even the transverse Van der Grinten. The only absolute requirement would be a central meridian that is of uniform scale, along which the projection is conformal.
So this transverse Van der Grinten IV would be an example of a "self-correcting" projection according to what perhaps is a weaker definition, one that doesn't decieve people who look at it, because the graticule of the projection reveals what is happening on the projection everywhere, with the distortion anywhere shown by comparing the graticule there with the graticule on the central meridian at the same latitude.
While it seemed reasonable to me to view the Sinusoidal projection as one that lent itself easily to overcoming its distortions, although the line of argument seems plausible, I have my doubts as to whether there is actually a useful self-correcting property in a case like this. Perhaps there is, to some extent.
But if one admits any projection that just has the right kind of central meridian, why does the central meridian even need to be part of the projection itself? So maybe the ordinary Mercator could be made self-correcting with the aid of an inset map showing what a meridian along the globe should look like:
I am not willing to claim that I have discovered a form of magic pixie dust with which the problem of distortion in map projections can be solved in any case! So it seems I have been defeated by a reductio ad absurdum. Or is an inset map of this type of some genuine value, even if it doesn't fully cancel out or overcome distortion?
Also, the Sinusoidal projection has inspired me to another idea which appears to have turned out to be a failure.
I had thought: why not start with a transverse Sinusoidal projection with a pole at the center,
![]()
and, somewhat along the lines of the transformation Aitoff devised, first expand the latitude by a factor of two, then compress the projection by a factor of two, in terms of the angle about the center, to compensate?
That yielded this as the result
which appears to be too distorted to be useful. It's also entirely possible someone else has thought of this before.
In case it is not clear how one goes from the Transverse Sinusoidal to this projection, it is important to note that the radial compression creates only half of the final result, and this diagram illustrates the process: