This projection
is another conventional projection, neither conformal nor equal-area.
Like the globular projection, this projection is constructed by drawing circular arcs for both the meridians and the parallels. However, while the globular projection serves as a simpler-to-draw replacement for the equatorial case of the azimuthal equidistant, a compromise about midway between conformality and equivalence, this projection has an obvious strong resemblance to the Mercator. Thus, while it is intended to moderate, slightly, the exaggeration of areas of the Mercator, and to provide a pleasing appearance with curved meridians and parallels, it definitely favors shapes at the expense of areas. (Again, it is not strictly conformal, but the Lagrange projection, which is somewhat similar in appearance, is.)
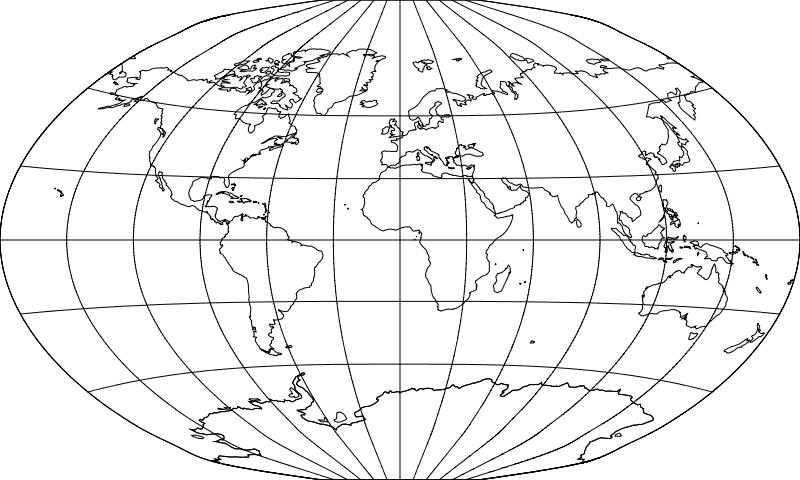
In fact, to realize that it even moderates areas at all compared to the Mercator, one must make a direct comparison:
If anything, given that its curved parallels and meridians may give it the appearance of truth, this projection might be viewed as even more dangerously misleading than the Mercator. To put it more simply, it would seem that only if one's conception of how the Earth looks, or at least how it should be represented on a map, has been shaped by the Mercator projection, would a projection like the Van der Grinten seem like a good idea. None the less, I still have to praise the ingenuity that allowed Van der Grinten to invent a very simple geometrical construction that is such a good approximation to conformality.
The meridians are constructed exactly as in the globular projection, except that the equator is now divided into 360 degrees instead of 180.
For the parallels, a simple geometrical construction determines where each parallel cuts the surrounding circle and the central meridian.
Divide the height of the projection uniformly to indicate latitude, as shown by the blue lines. Then, where a line (shown as red in the diagram) drawn from the bounding circle at the height corresponding to a given latitude to the point where the other side of the bounding circle intersects the equator intersects the central meridian is where the parallel for that latitude crosses the central meridian.
The height at which the parallel for that latitude intersects the bounding circle is found in a similar fashion. Here, however, instead of the bounding circle, one uses a diagonal line (shown in green) between a pole of the projection and a point where the bounding circle crosses the equator. A line (shown as purple) is drawn from the point on this diagonal line at the height determined by the uniform division of the height of the projection and corresponding to the desired latitude, again to the point where the bounding circle crosses the equator at the other side. The height of the point where this line crosses the central meridian is the height at which the parallel, as drawn on the actual map, intersects the bounding circle.
It turns out that I didn't have to draw that diagram myself. A similar diagram appears in many atlases by the firm of John Bartholomew and Son, Limited, right down to the nineteen-sixties. I have just recently discovered, though, that it appeared in an atlas published as early as 1917, and thus out of copyright, The Advanced Atlas of Physical and Political Geography, published by Oxford University Press.
This diagram, shown below, is part of two pages containing numerous diagrams illustrating several different map projections.
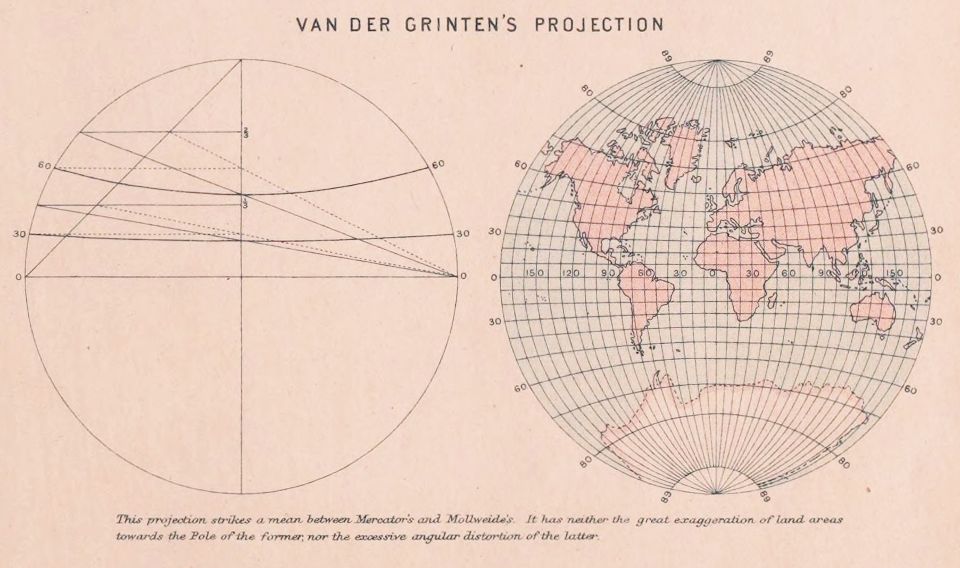
The legend at the bottom, which states:
"This projection strikes a mean between Mercator's and Mollweide's. It has neither the great exaggeration of land areas towards the Pole of the former, nor the excessive angular distortion of the latter."
becomes much more forgivable when I realize that it was written in 1917 or earlier.
By today's standards, the Van der Grinten projection can hardly be considered to stand halfway between the Mercator projection and, say, the Aitoff-Hammer projection - it only moves a small distance away from the Mercator in the direction of an equal-area projection.
But the tastes of the past, which favored conformal projections over equal-area ones, are actually quite understandable; the gross distortions in most equal-area projections of the whole world are an impediment to the usefulness of such projections for general geographical reference, as opposed to presenting statistical information.
It's only when people started to use equal-area pseudocylindrical projections such as the Sinusoidal and the Mollweide in interrupted form that they became more tolerable... and, as I note elsewhere, this was an idea that J. Paul Goode came up with in 1916. Just one year prior to this atlas being printed.
So, while it seems strange to today's cartographic sensibilities - but apparently not too strange, since a lot of wall maps are still being printed on the Van der Grinten projection, even if the National Geographic Society has abandoned it, first for the Robinson (in their September, 1988 issue), and then for the Winkel Tripel (the National Geographic site gives the April 1995 issue as when that happened, while most sources give the date as 1998; the map in the April 1995 issue was a special-purpose world map, showing earthquake zones around the world, and as the National Geographic has used projections other than its usual projection for world maps on occasion for special-purpose maps, it makes sense that the publication of a political or physical world map in the Winkel Tripel projection would be seen as when the changeover really happened) - it could easily have been felt, at least at that time, that the Van der Grinten went about as far as one could safely and reasonably go from the Mercator towards an equal-area projection.
This inspired me to go to Flex Projector to construct a map in the arithmetic mean between the Van der Grinten projection and the Winkel Tripel projection, to see what something halfway between the older view and the current view of what a compromise between the Mercator projection and an equal-area projection should look like.
It seems quite attractive looking.
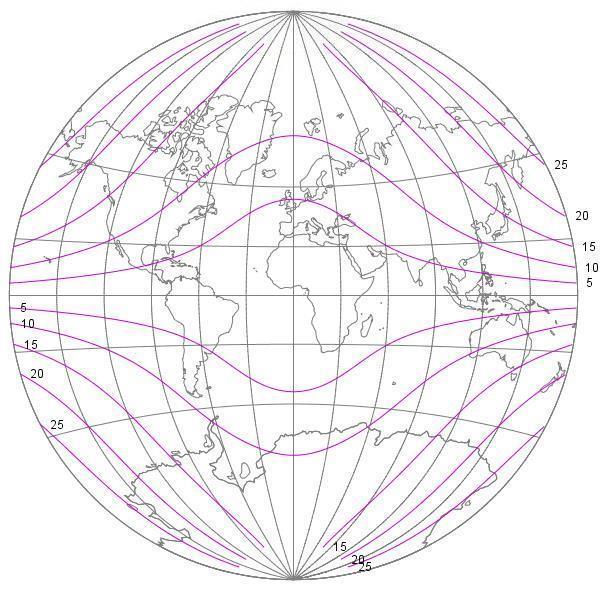
Also thanks to Flex Projector, here is a chart showing the distribution of angular distortion over the Van der Grinten projection:
and one showing the distribution of size distortion over this projection:
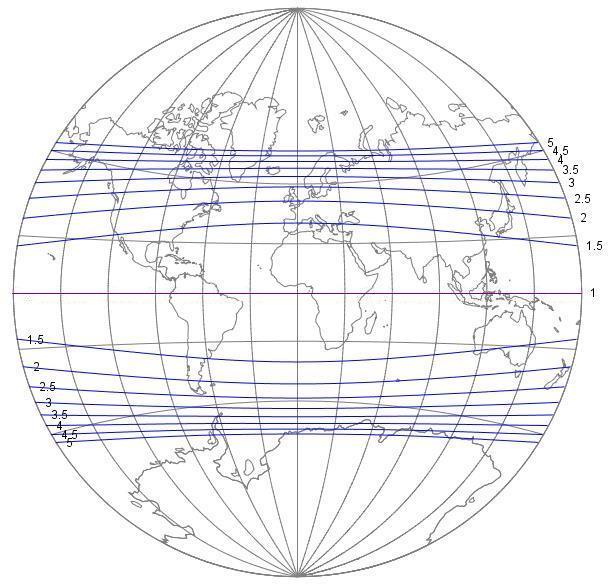
For this projection, angular distortion is very low, but size distortion is quite severe, as was readily apparent even without these charts.
For serious cartographic applications, it is natural to entertain serious doubt about the utility of this projection. It doesn't have the useful property of strict conformality, and, without that excuse, it would seem impossible to justify the exaggeration of areas in this projection. Other near-Mercator projections, like the Miller Cylindrical, are perhaps forced to exaggerate areas because they are cylindrical, therefore preserving the four cardinal compass points in conventional aspect.
However, the achievement of van der Grinten in so closely approaching conformality in a projection with such a simple construction is still one that is worthy of praise. At the least, given the familiarity of the Mercator projection, this projection seems to be an excellent choice as a map of the world for decorative purposes.
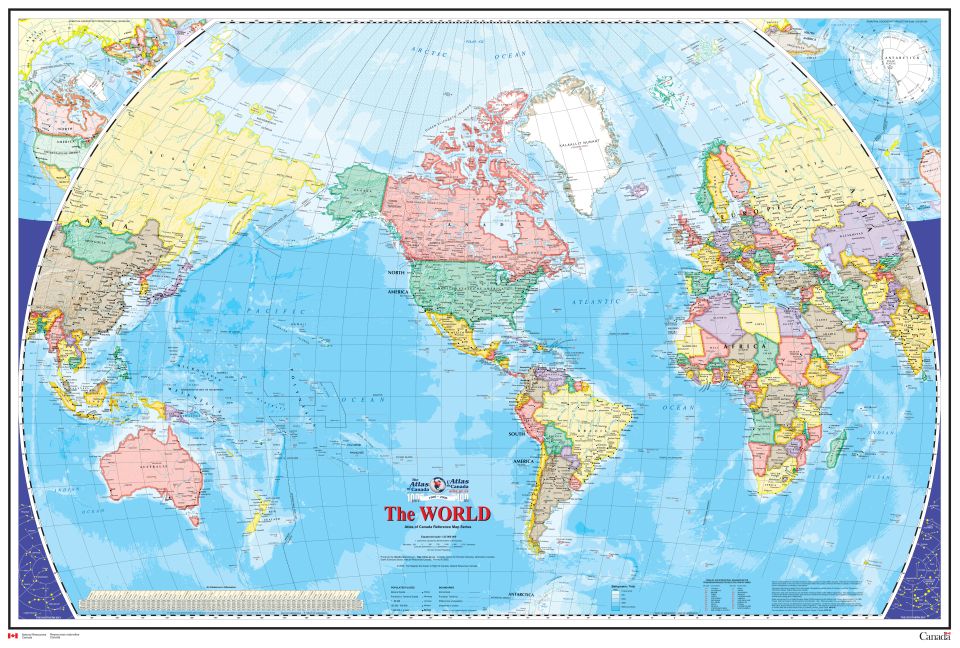
For many years, the National Geographic Society made beautiful and detailed world maps on the Van der Grinten projection. As they began doing so in 1922, I can reproduce one of them here:
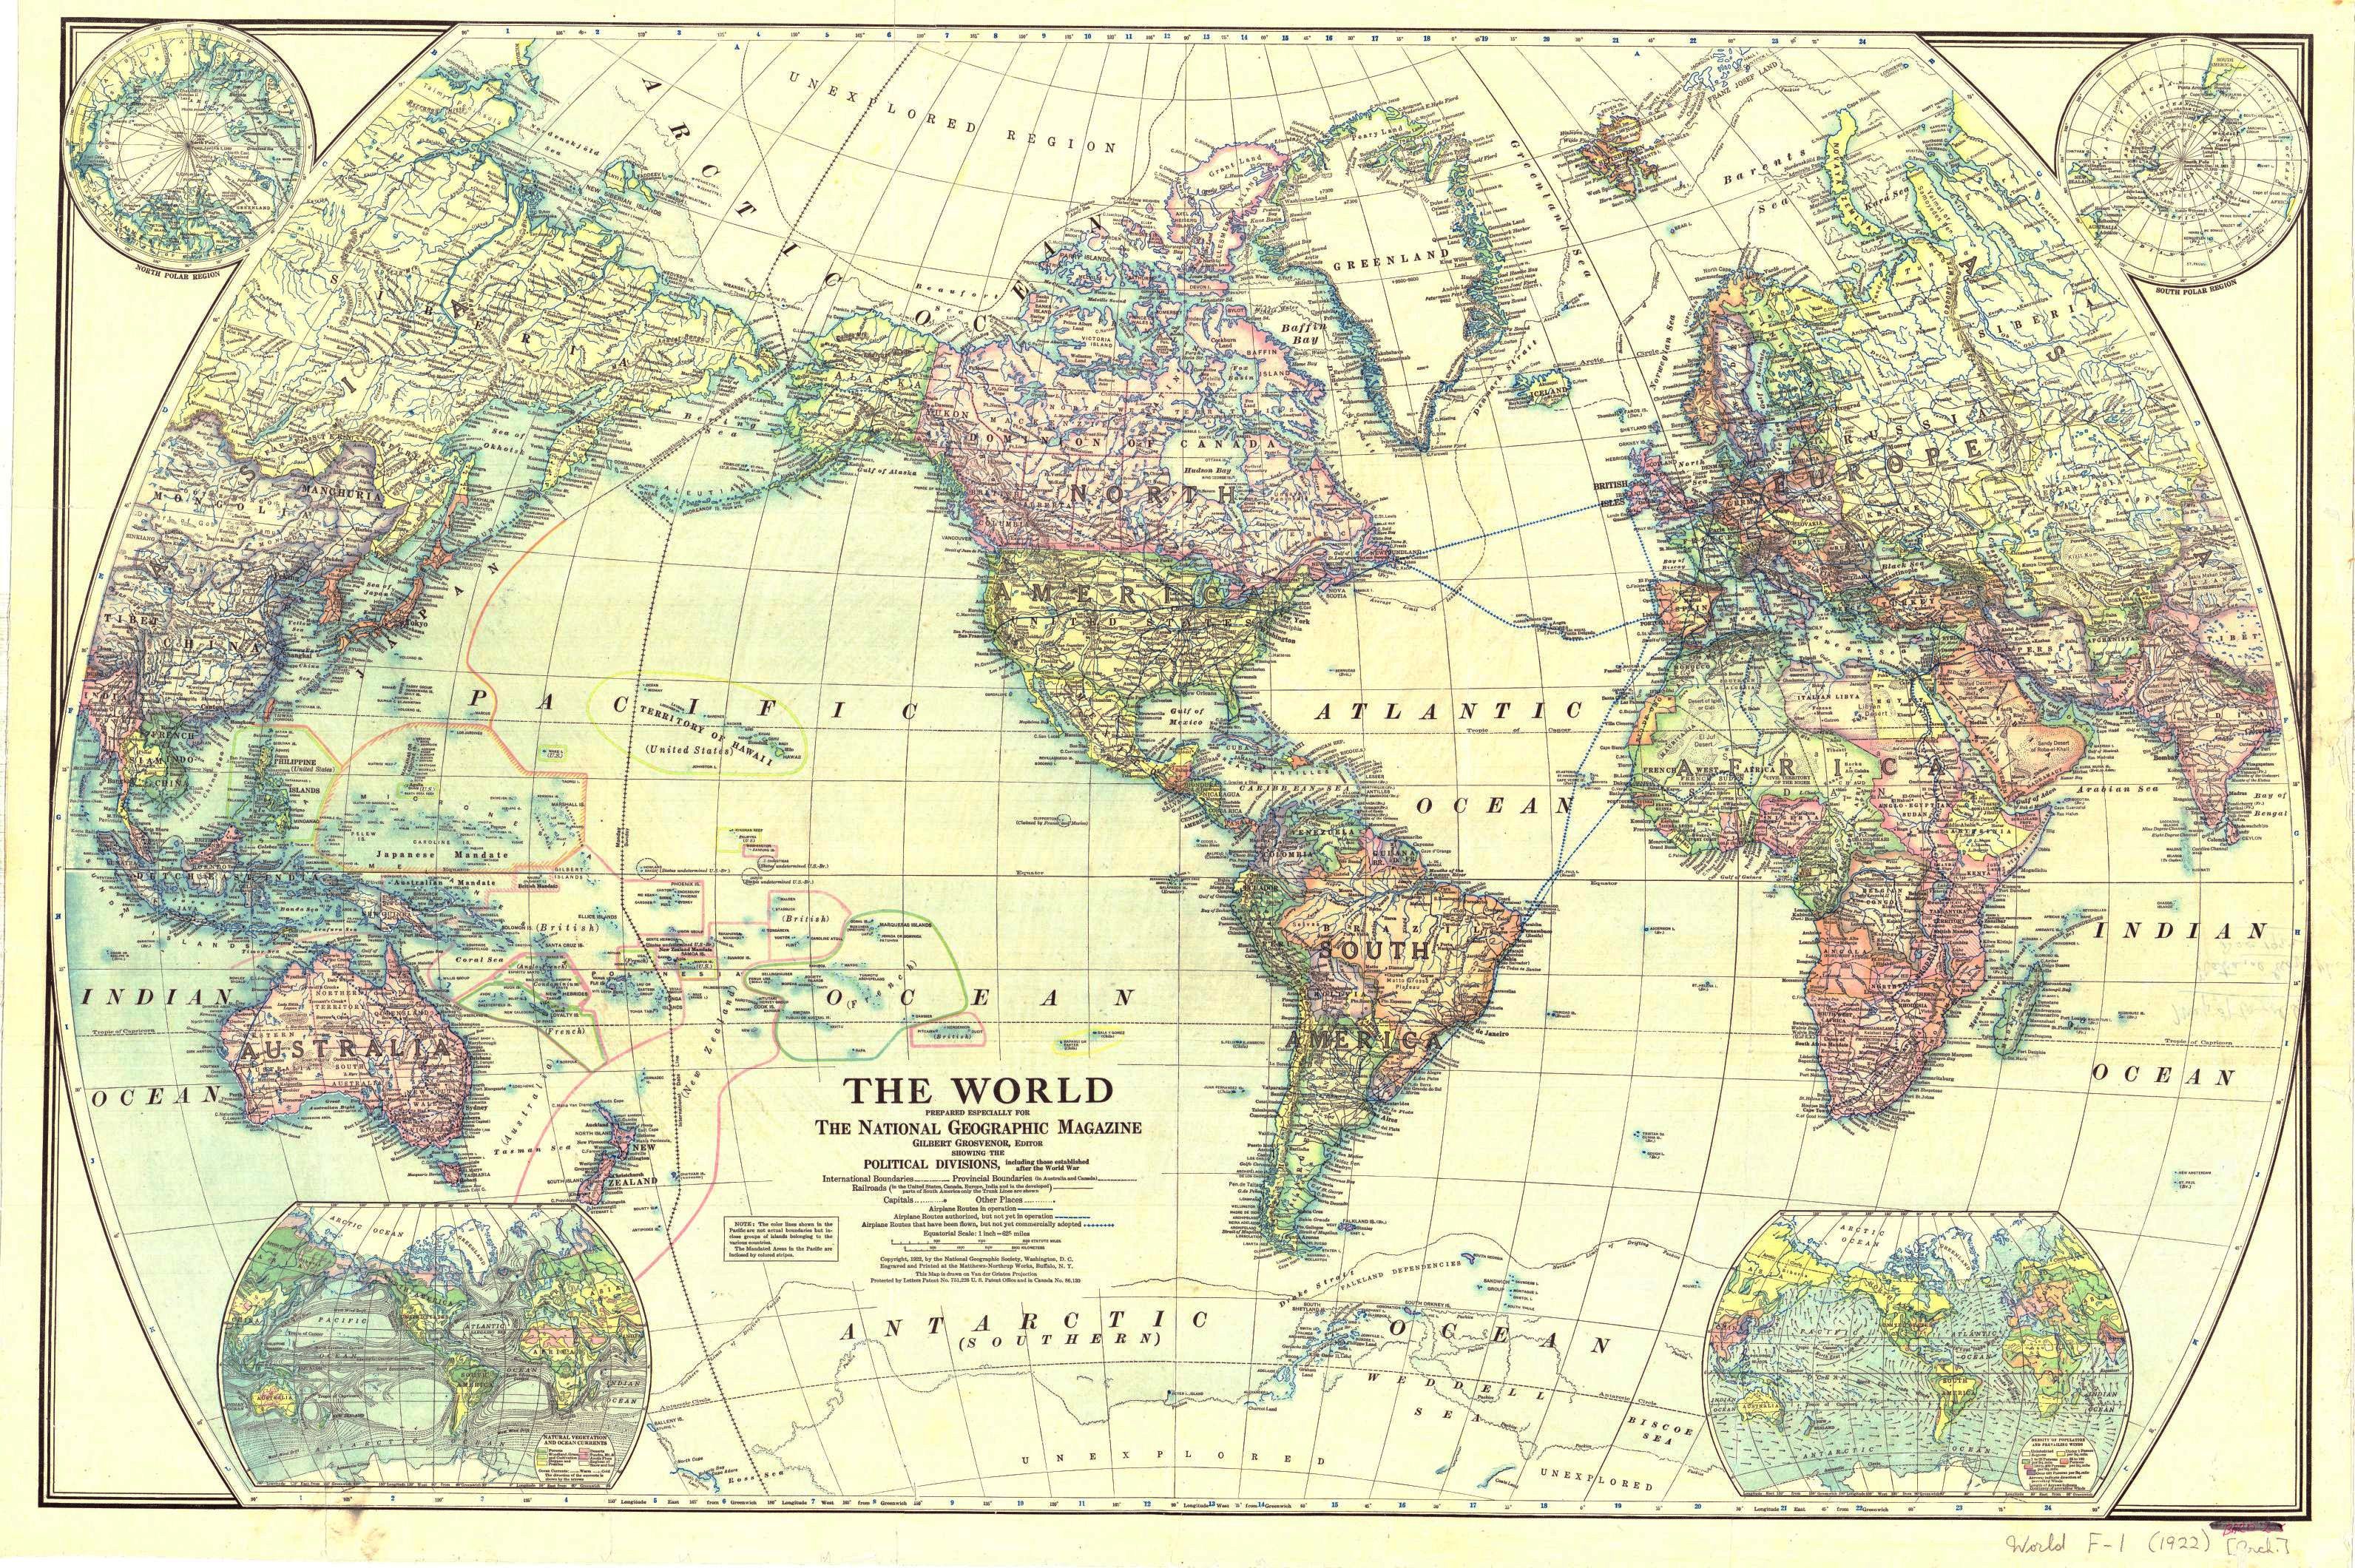
But in order to fit it on my page and your computer screen, I have had to shrink it down to a level that hardly does it justice, and so I have made available a larger version you can see by clicking on the map.
Even the Government of Canada, for the Atlas of Canada, before it switched to the Winkel II projection, as noted on a previous page, made use of the Van der Grinten projection, as shown below:
The image above is © Copyright 2005, Her Majesty the Queen in Right of Canada, as represented by the Minister of Natural Resources, and is presented on this web page under the terms of the Open Government License - Canada 2.0.
no doubt inspired by the decision on the part of the National Geographic Society in the United States to choose that projection for its world maps.
By following this link, you can download your own copy of this map in full size.
On a previous page, I mentioned that it was difficult for me to find maps showing Tannu Tuva that I could use, but later on, I did find some more examples, one of which is shown here.
Here is a world map from 1949 which not only shows Tannu Tuva (which was actually officially named Tannu-ola for much of its existence) and Jehol (located between Mancuria and China proper), but which also had one apparent error that raised my eyebrows. Iran is shown on the map, but so is Persia. At first, I thought they had given the name to Lebanon, but since Syria, which is much larger, also does not have its name appear on the map, presumably it is the place to which the name Persia is meant to refer; and while I doubt strongly that Lebanon, the name of which even appears in the Bible, was ever called "Persia", I had thought there was at least a slim chance that Syria was called Persia at one time for some reason... however, since then, I did some checking, and I am now rather confident that this was just a mistake on this map.
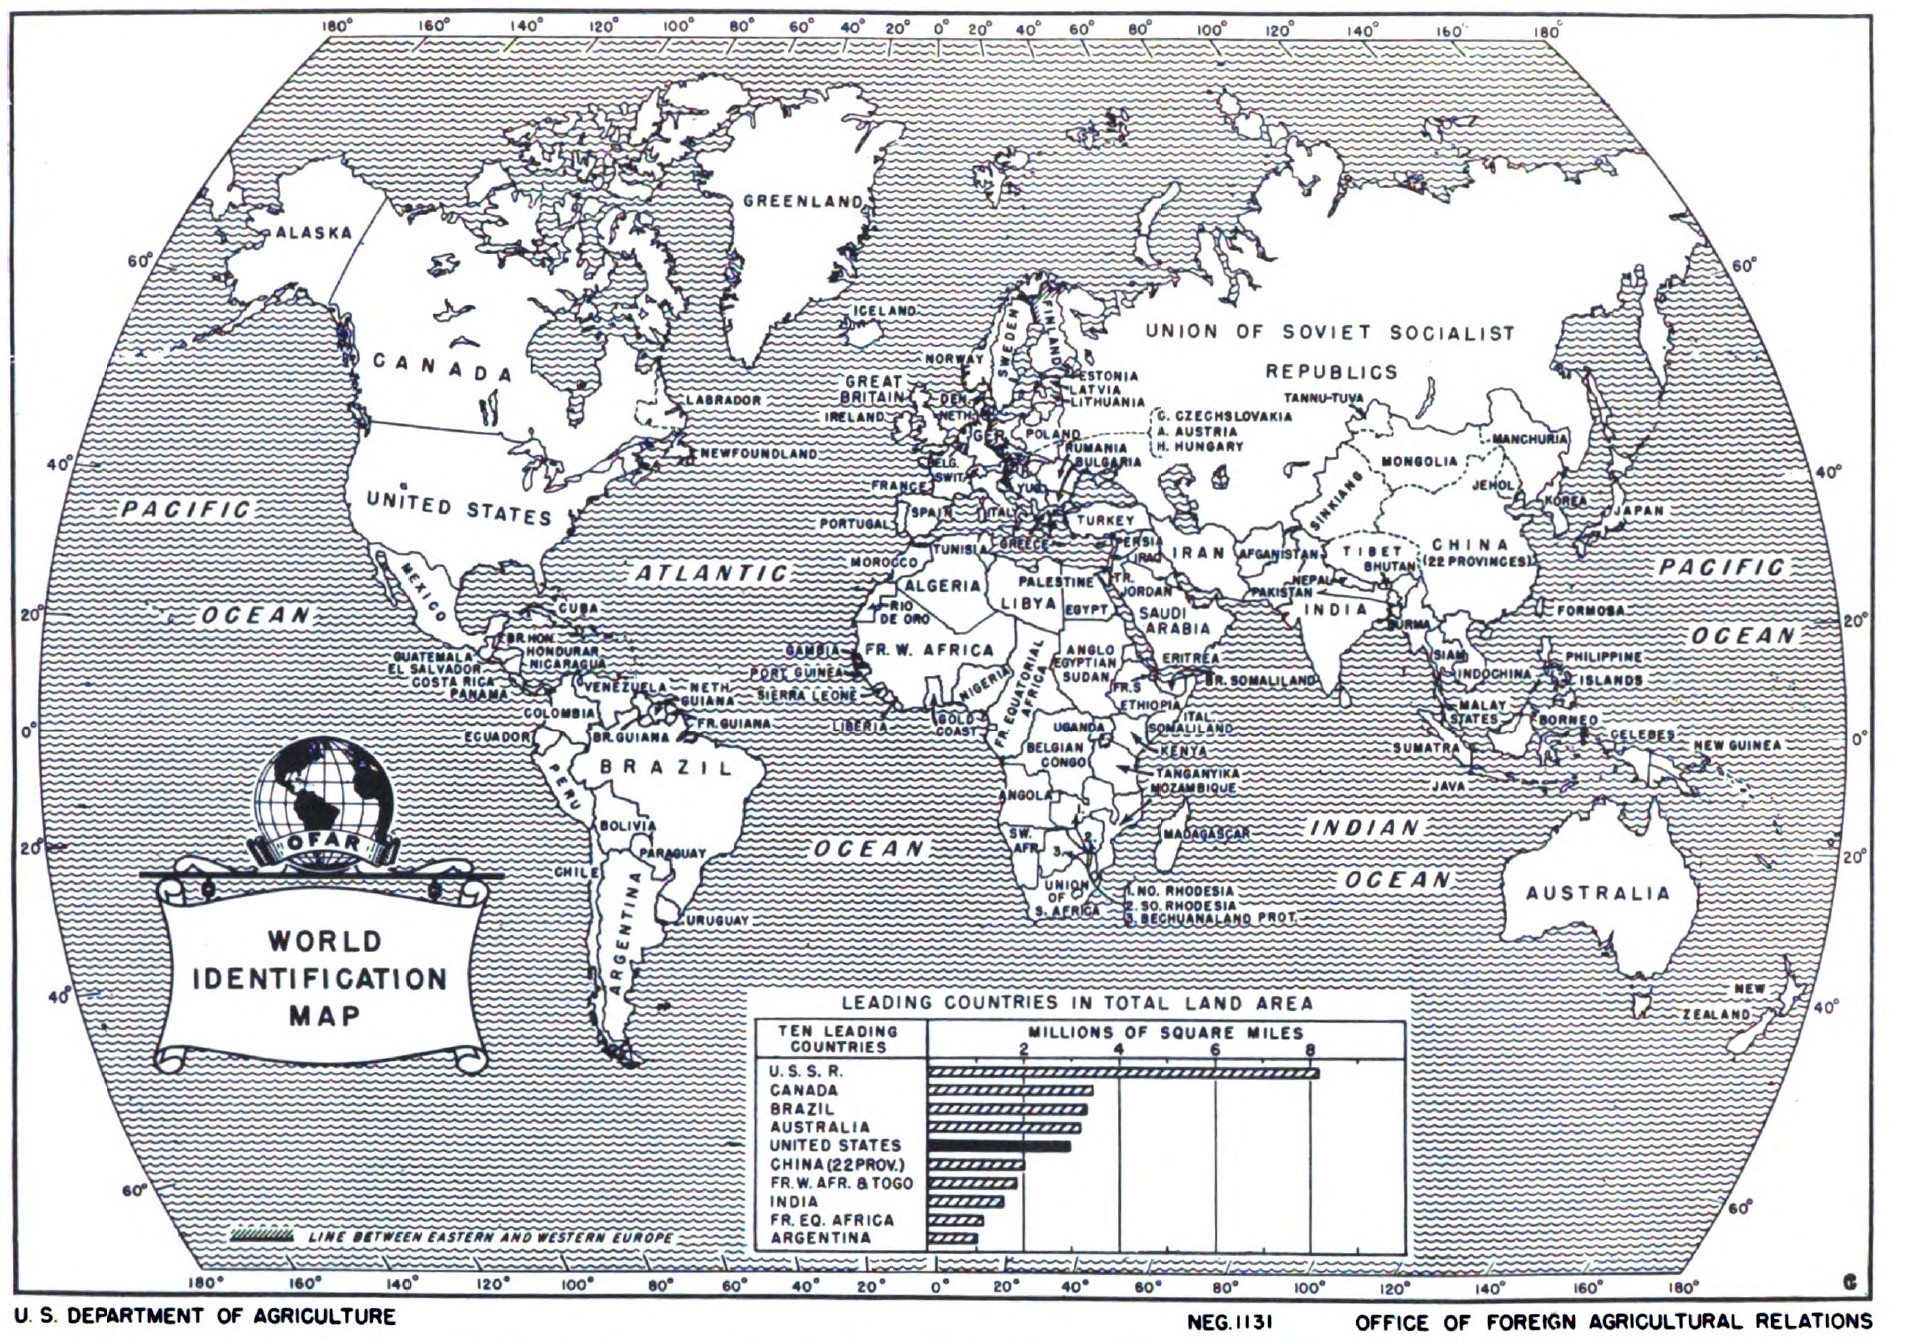
Clicking on the map will bring up a larger version, in which all the names are more clearly visible. Although it is a post-war map, note that Poland is shown with its pre-war boundaries. Also at least mildly unusual is that according to this map, Finland is considered to be a country in Eastern Europe.
The van der Grinten III projection, where the parallels are simply straight lines with the spacing given in the center of the projection, has also been popular, even though the graticule of the entire projection looks somewhat strange. This projection is also known as the Brooks-Roberts projection. It works quite well, as long as the polar regions of the map are excluded.
Every now and then, I have seen maps that look very much like the normal van der Grinten projection, but which are labelled as being drawn on a "Modified van der Grinten Projection". This name has also been used for maps drawn on the Van der Grinten III projection as well; one place where it was so used was by the U. S. military during World War II. Given that the Van der Grinten III projection seems to work well, perhaps a suitable modification of the Van der Grinten might be to change the point at which the parallels intersect the boundary of the projection to a weighted average of three parts the original boundary height, and one part the center height, giving the following projection:
It might seem there is no difference, but if you look closely at how Alaska appears in the modified projection and the original, it seems that a tiny improvement has been achieved.
And a direct overlay also allows the very subtle difference to be seen:
Although this is a conventional projection, and therefore an oblique aspect is not really applicable to such projections, because an oblique aspect gives a different perspective on a projection, it allows its distortions to be perhaps more readily seen. Thus, here is this modified form of the Van der Grinten projection in the oblique aspect used in other examples on these pages:
Changing the mixture to two parts of the original boundary height, and one part the center height, is another possibility, and yields this attractive map:
And here is the result if the intersections of the parallels with the edge of the map are determined by a half-and-half mixture of those of the original Van der Grinten projection at the edge, and those in the center (as used on the edge in the Van der Grinten III projection):
This resembles the form of the "modified Van der Grinten projection" used on some classroom maps that I have recently turned up in a web search.
Given that it so closely approaches conformality, it seemed worthwhile to ask if applying a conformal transformation to the world so that a hemisphere could be placed within a van der Grinten projection (superimposing a double-sized Mercator over one at normal scale) would produce an attractive projection. This is the result:
A projection is obtained which resembles the globular projection, but which has a slight expansion of scale along the central meridian towards the poles.