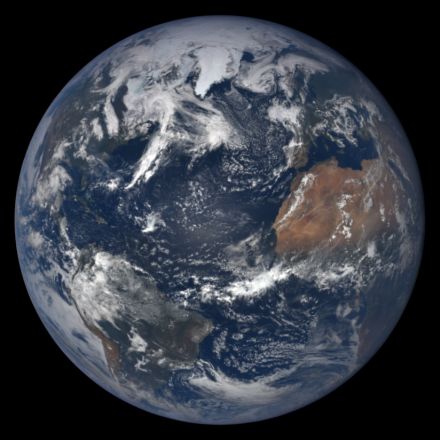
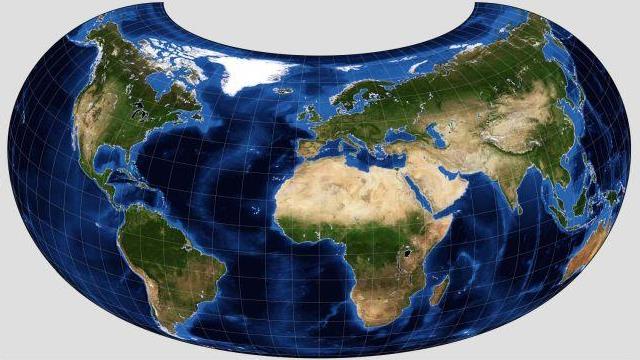
The world we live in...
is a round globe. Small areas on it, of course, are so nearly flat, one cannot tell the difference.
Incidentally, the image above is from NASA's Earth Polychromatic Imaging Camera.
But when one is drawing a map of the whole world, or even a whole country, one has to decide how one is going to represent our spherical world on flat paper. Many different solutions have been developed over the years, and a few of them will be examined on these pages.
Even when making a globe, it has been only practical to do the printing on flat paper, but since if you try to flatten an orange peel, it will break into pieces, the best that can be done is to divide the surface of the world into thin gores:

that presumably can be fitted to a globe with a slight amount of stretching.
There are solids with curved surfaces that can be perfectly represented on flat paper. Without stretching, you can roll up a flat piece of paper into the surface of a round tube - or a cone. So the side surface of a cylinder, and the pointed surface of a cone are called developable surfaces. The surface of a sphere definitely is not: the area around a given point, as you go further away, gets smaller and smaller compared to the area the same distance away from a point on the plane. As will be mentioned shortly, the fact that the cylinder and the cone are equivalent to flat paper means that they have been used to fit the sphere better than a tangent plane, giving rise to "conic" and "cylindrical" map projections, as opposed to "azimuthal" ones, based on the tangent plane.
Turning the cylinder (which is probably obvious) and the cone into flat pieces of paper is illustrated here:
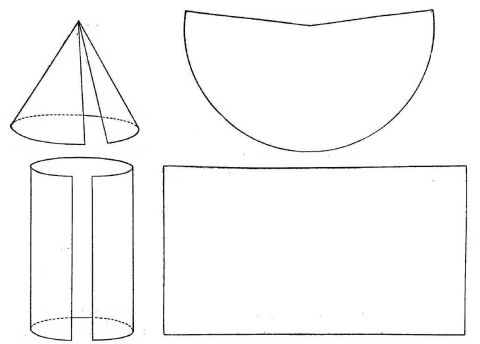
with artwork from Elements of Map Projection by Charles H. Deetz and Oscar S. Adams, U. S. Coast and Geodetic Survey Special Publication No. 68.
Map projections can be grouped together in two basic ways; and a third characteristic, although it divides different ways of using the same projection, is sometimes considered important enough that different versions of the same projection varying only in this characteristic are given different names.
The first characteristic is system or class. This identifies the basic layout of the projection. The most important projections are either cylindrical, conic, or azimuthal. A flat piece of paper can, without stretching, be bent into a cone or a cylinder, and in this way, it can touch a globe along an extended line; if left flat, it only touches the globe at a point.
These basic types of a projection are illustrated in this diagram:
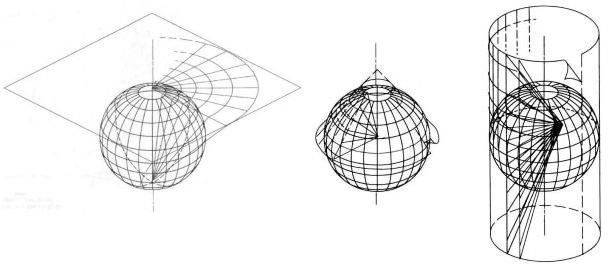
For ease of understanding, in each case, the sphere is shown as being literally projected to the plane by straight lines originating from a point; this is only true for perspective projections, and a projection doesn't need to be a perspective projection to be azimuthal, conic, or cylindrical. What matters is the way the meridians are arranged in the orientation of the projection shown in the diagram; the positions of the parallels have to be the same along each meridian, but they can be arrived at by any mathematical function, not necessarily by projection from a point. (I could not easily draw something like this, so these diagrams are sourced from a U. S. Government publication, specifically an Army technical manual.)
The basic mathematics of obtaining several important properties of maps is different in these aspects.
There are other types of projection than these three basic types. A projection can be pseudocylindrical, which means that although the parallels of latitude are straight lines, the scale along them varies, so the meridians are no longer perpendicular to them, or (necessarily) straight lines. Pseudoconic and even pseudoazimuthal projections are also possible: but this uses the term "pseudoazimuthal" in the non-standard sense of a projection like the Werner cardioid projection; instead, the term is currently used for another type of projection that is so far beyond the scope of these pages - and the Werner cardioid is called pseudoconic instead. As well, there is the polyconic projection, and there are many conventional projections.
Projections are also classified in terms of their properties. Specifically, on the basis of two very important properties: whether they are conformal, or equal-area, or neither. A conformal projection maintains the shape of small regions, so angles at any point are correct, although sizes will change. An equal-area projection, on the other hand, maintains size at the expense of shape. Maintaining both size and shape, of course, requires a globe.
In general, and this is true for the projections in the three basic aspects of cylindrical, conic, and azimuthal, scale going away from the center of a map increases for a conformal projection, and, for an equal-area projection, scale in the direction away from the center of the map decreases, to compensate for an unavoidable increase in scale in the direction perpendicular to that from the center of the map.
Most projections that are neither conformal nor equal area have a scale behavior that is somewhere in between. However, two very important azimuthal projections lie outside this range: the gnomonic projection, which can be used to find the great circle path between two places, and whose scale expands more quickly than that of a conformal projection, and the orthographic projection, which looks like a picture of a globe, whose scale shrinks more quickly than that of an equal-area projection.
A map designed for a specific special purpose, particularly one related to navigation, can also be called a chart; this is applied to maps on both the Mercator projection and on the Gnomonic projection. On the other hand, a map on the Orthographic projection can be thought of as a picture of the globe instead of a map. Whether one chooses to view all this as a manifestation of an unjustified prejudice against map projections outside the equal-area to conformal range, or a normal response to the fact that such projections are special-purpose in nature, is a matter of opinion.
Finally, there is the case of a projection, also termed its aspect. Just as you can move a globe you are holding in your hand, so too one can think of the graticule, the lines of latitude and longitude on the globe, as being movable.
So one can move the globe, or move the graticule on the globe, and draw a map of a shifted world: that is, although the usual rules for drawing a projection place the lines of latitude and longitude on it in a given way, one can shift the world under the projection's graticule, and treat the original graticule of the world like the coastlines and borders on the globe, as simply things to be drawn where they happen to be.
There is the conventional (or, in the case of an azimuthal projection, polar) case, where the projection is drawn in the normal and easiest fashion. There is the transverse (or, in the case of an azimuthal projection, equatorial) case, in which the globe has been shifted by 90 degrees before the map is drawn, and there is the oblique case where the globe is shifted by a lesser amount.
Although some azimuthal projections can be drawn in other cases relatively easily, drawing most other map projections in a case different from the conventional one was very difficult before computers came along to draw maps for us. This meant that in some instances, alternative cases of the same projection were viewed as significant enough to be considered a projection in its own right. Thus, the transverse case of the Mercator projection is also known as the Gauss Conformal Projection; the transverse case of the Plate Carré projection is known as Cassini's projection.
As well, a transverse case of the Mollweide is known as Bartholemew's Atlantis projection, and an oblique case of the Hammer-Aitoff projection is known as Bartholemew's Nordic projection.
In the case of a cylindrical or conic projection, the distinction between the conventional form of the projection, the transverse form of the projection, and an oblique form of the projection is sufficient to fully classify the aspect of a projection. In the case of a projection where, in the conventional aspect, the meridians are not all the same, there are other distinctions to consider.
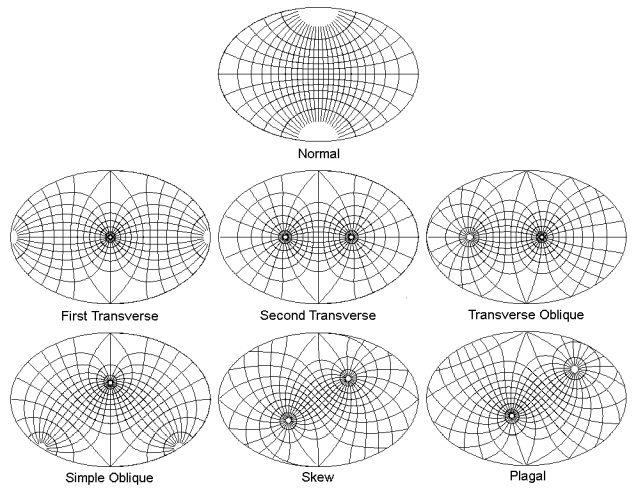
A paper by Thomas Wray, in the December 1974 issue of the journal Cartographica finally pointed out the possible significant cases, of which there were seven.
This classification acknowledges that when the pole is tilted along a 90 degree meridian of a projection like the Mollweide or the Hammer-Aitoff, there is also a symmetry present in the projection, just as there is bilateral symmetry when the tilt is along the central meridian of the projection.
These aspects are illustrated below (after, of course, other illustrations of this, including Wray's own, but drawn myself with a different projection):
This classification, however, is best suited to projections which, like the Mollweide and Hammer-Aitoff, have bilateral symmetry, in the conventional case, not only around the central meridian, but also around the equator of the projection. One example of a projection lacking the latter symmetry is the Hill Eucyclic, as drawn here by G.Projector, a program for creating maps from input in the form of a map image in an equirectangular projection written by Dr. Robert B. Schmunk and available from NASA at the Goddard Institute for Space Studies:
And it doesn't cover projections with additional symmetries: thus, tilting the pole by 45 degrees along the meridians which form the borders of hemispheres has special significance in Gouyou's Doubly-Periodic Projection:
Thus, while this classification is applicable to a very common class of projections, as there are projections with different symmetries, different classifications may be needed to apply to those types of projection.
This site is chiefly concerned with map projections from a mathematical point of view, although heavy-duty mathematics has tended to be avoided where possible (thus, the conical projections have only been treated with one standard parallel) but included where necessary (complex numbers and elliptic integrals are mentioned in connection with certain exotic conformal projections). Thus, the complexities excluded are those of interest primarily to professional cartographers; those included are those that may fascinate those outside that field but with a mathematical or technical background.
Originally, the spheroid was ignored entirely on these pages, but now the formulas for the very simplest case of accounting for the world being approximated by an ellipsoid have been given, for conformal maps on the page about the Mercator projection, and for equal-area maps on the page about the Lambert equal-area cylindrical projection.
Of the projections described here, some are projections that you would not be likely to see in an atlas, but many of them have been so used.
In an old-fashioned atlas, the choice of projections was usually fairly limited.
It would likely start out with a map of the world on Mercator's projection. The individual continents might be drawn using projections intermediate between an equal-area projection and a conformal projection. Canada, the United States, Australia, and Europe might be drawn using the simple conic. South America might be drawn using the polyconic projection. Antarctica on the azimuthal equidistant projection.
Russia and China could also be drawn on the simple conic projection. Typically, though, what such an atlas would include is a map of Asia, and there the pattern would break down. A very old atlas might opt for depicting Asia on the Stereographic projection. Later, Bonne's projection tended to be favored for that purpose, and it, rather than the simple conic, would likely be used for Russia as well.
Africa might end up on the Polyconic projection, the Stereographic, the Sinusoidal, or even the Mercator.
Later on, Lambert's azimuthal equal-area projection became the preferred choice for maps of Asia, and the convention in more recent atlases has tended to be to use Lambert's azimuthal equal-area for all the maps except world maps.
Some modern atlases have favored the conformal instead, tending to use Lambert's conformal conic for most of the maps. An oblique Mercator projection was used to very good effect in the Oxford atlas for a map of the Americas, and I illustrate this application of the Mercator within these pages. (I have not attempted to illustrate the scheme of projection involving two oblique Lambert's conformal conic projections of differing orientation patched together which was used for a much-acclaimed map of the Americas referred to in many texts on cartography, however - at least, not in its fullness. I did refer to it, and show an illustration of the two conformal conics used in it, but without attempting to replicate how they were stitched together, in the page on the Lambert conformal conic.)
Even when the atlas maps are nearly all in Lambert's azimuthal equal area, the convention of using the Mercator for the world map has often been retained, particularly in the traditionally-minded English-speaking world. But other choices have definitely been used, such as Winkel's Tripel, the Miller Cylindrical, the Mollweide projection (with or without interruptions), the Van der Grinten projection, or even the Van der Grinten IV projection. And many atlases will use an interrupted Sinusoidal or some other equal-area projection for a series of informational maps in the back of the atlas (or, in some cases these days, the front).
Also, an atlas might have a Mercator projection as its main world map, and then include a second one for contrast, such as a Mollweide, or the Eastern and Western hemispheres on the Stereographic projection or the Globular projection, the Northern and Southern hemispheres on the Azimuthal Equidistant, or even an Azimuthal Equidistant centered on the North Pole or on London. The intent might be to show a true equal-area projection, to show a conventional projection that at least improves upon the Mercator's depiction of areas, or to illustrate great-circle routes of air travel. And then some atlases have used an oblique (or even transverse) Mollweide or Hammer to both provide an equal-area world map and illustrate great-circle routes.
And I haven't even mentioned Bartholemew's Regional projection, which appeared in one form in Bartholemew's Atlas, and which was changed for an appearance in the five-volume Times Atlas of the World. As in these cases, sometimes the main projection will be used for a political map of the world, and an alternative projection for the physical world map.
And then there are the atlases that don't use the Mercator projection for the main world map, but sneak one in for a map of world time zones. The Miller Cylindrical projection, the cylindrical equal-area projection, or even the Eckert IV projection, not cylindrical, are other possible choices.
I've written a little BASIC program that draws maps of the world in the form of .xbm graphic files. I then viewed them in my web browser, press Alt-Print Screen, paste the result in a paint program, and save the images in a more compact format I present on these web pages. Since the XBM file format is bulky, however, web browsers have dropped support for it; so now I use IrfanView with a plug-in.
The data points I use to plot most of these maps are from GSHHS, a cartographic data set available at the U. S. National Geophysical Data Center. The lowest-resolution version of the data set is used by my BASIC program, as converted to text format by the program provided. Note that the data files at that site, although they bear the ".gz" extension, are NOT compressed, although they are binary. (This may have been done to avoid problems with web server software that did not recognize the .b extension of those files.) The ones with the ".bz2" extension at the Hawaii site are compressed, using the bzip2 program, which is available in a version for conventional PCs, even though it is mostly used under Linux.
Subsequently, I added to the program the ability to use files produced by pscoast within GMT, which I thought stood for the Generalized Mapping Toolbox, but I see the initials actually stand for the Generic Mapping Tools (that is, when they're not standing for Greenwich Mean Time). However, in order to keep the ability to exclude small lakes, I continue to read the coastlines in the original GSHHS format, which includes more information, and is faster for my program to read (which is not a criticism of GMT, as it is intended to work in the world of the UNIX operating system and compatible operating systems, not with QBASIC programs).
The information for the construction of the projections discussed here is, for many of the more common projections, derived from any of a number of standard works, but for some of the more exotic projections, various specialized sources, such as D. H. Mahling's Coordinate Systems and Map Projections, An Album of Map Projections by Voxland and Snyder, Elements of Map Projection by Deetz and Adams, and others, were helpful.
This site, needless to say, does not describe all the map projections in existence, although to people unfamiliar with the subject, it certainly will seem to describe quite a few of them, including many they've never heard of.
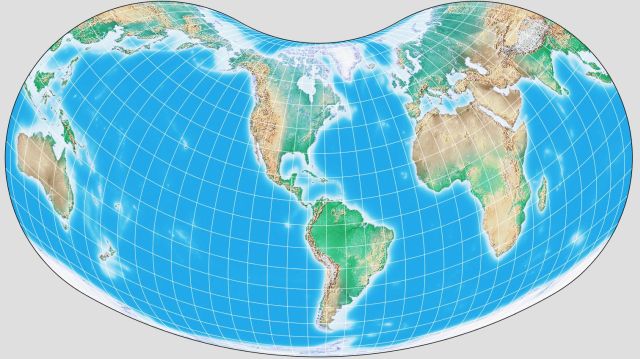
However, even some fairly well-known ones have not been discussed on this site, at least not yet. Although I have encountered formulae for the two-point equidistant projection and even the Chamberlin Trimetric projection, I felt that sort of projection would present some problems in implementation in my very simple BASIC program without a fancy interface. I admit I ignored the Goode Homolosine projection specifically because of a dislike for one feature of it; there is a sudden change in the direction of lines crossing the parallel at which the Sinusoidal and Mollweide projections are joined. Unfortunately, the Philbrick Sinu-Mollweide projection has the same issue, despite switching (only in the Southern hemisphere of the projection) in the opposite direction. On the other hand, while I like the Armadillo projection very much, I haven't seen formulae for the little area with New Zealand on it - and it is a projection in a class by itself, requiring a new chapter.
I have found a solution to that issue, however, and thus include above a world map on the Armadillo projection drawn by the program G.Projector which is available from NASA. As can be seen, like the Orthographic projection, it's a drawing of a solid object, in this case, though, not a globe, but rather part of a toroidal shape on which a map of the world is drawn.
I have eschewed describing the Robinson projection because of the way in which it is defined - based on a table of scales for each latitude found to be subjectively optimal, rather than directly from a mathematical formula, although some computer programs do attempt to draw it based on formulas that are designed to match that table. As well, as noted above, I did not attempt a drawing of the Bipolar Oblique Conic Conformal projection (used for a noted map of the Americas by the American Geographic Society) because apparently the two Lambert Conformal Conic regions from which it was made were joined together in an arbitrary fashion; however, I did eventually exhibit the two conic projections by themselves.
The projections involving conformal representations on equilateral triangles devised by L. P. Lee were originally not described here, though they are the sort of thing I would like very much to include, because I felt unprepared to wade into the waters of the Schwarz-Christoffel formula myself, let alone guide the readers of these pages into such territory - but more recently, I found a way to illustrate them, and on the page I have added, I've kept the mathematics to a minimum. The map projections based on elliptic integrals which I included from the start are already a venture into very advanced mathematical territory, even though they're based on the common garden-variety elliptic integrals actually mentioned in standard mathematical works like Abramowitz and Stegun or Jahnke, Emde, and Lösch. (And if you're not familiar with the first work, Handbook of Mathematical Functions and the second, Tables of Functions with Formulas and Curves originally, when just Jahnke and Emde were authors, and Tables of Higher Functions when Lösch was added, the mathematics involved likely will make no sense, and be of no interest, to you.) Dixon elliptic functions, the ones needed for conformal projection to an equilateral triangle, enjoy no such widespread fame, although they can be expressed in terms of elliptic functions that are more commonly referred to; there's a formula for that on their Wikipedia page.As noted above, I've also avoided dealing with the spheroid and the use of two standard parallels with conic projections at this time.
Note, too, that some projections, instead of getting a section to themselves, are merely mentioned (and, usually, illustrated) in passing during the discussion of another projection. These projections are mentioned in the table of contents below so that you can find them as well.